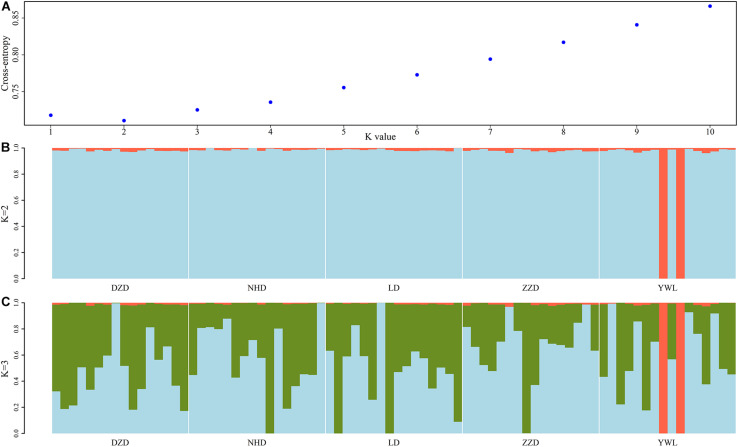
FIGURE 3.
Admixture analyses of 80 individuals based on the genome-wide single-nucleotide polymorphisms (SNPs). (A) Cross-validation plot for the number of ancestral populations (k). (B) Stacked bar plot for the k = 2. (C) Stacked bar plot for the k = 3. Each column represents an individual, and the length of colored segments denotes the proportion of an individual’s genome inherited from one of k ancestral populations.

