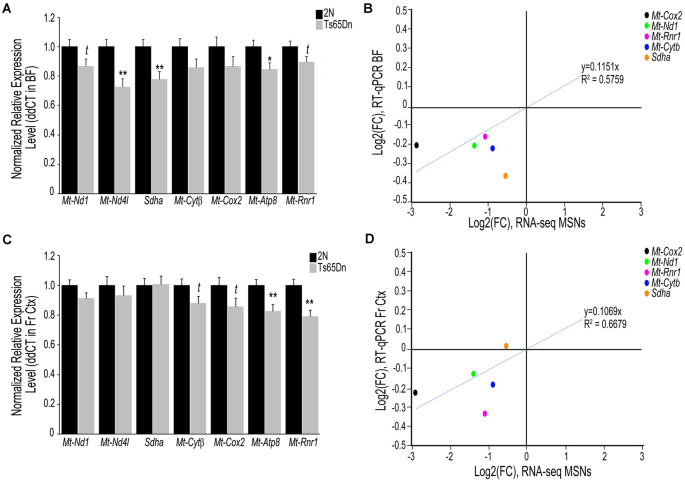
Figure 2.
Interrogation of oxidative phosphorylation Complex I-V subunit gene expression within the trisomic basocortical circuit. RT-qPCR was performed to determine gene expression levels using regional dissections of the basal forebrain (BF; A,B) and Fr Ctx (C,D) from Ts65Dn and 2N littermates at ~6 MO for six genes. (A) Bar graph represents ddCT of each gene normalized to 2N levels in the BF. Significant downregulation was found for Mt-Nd4l, Sdha, and Mt-Atp8 and trend-level downregulation was found for Mt-Nd1, Mt-Cytβ, and Mt-Rnr1. (B) Correlation plot association between MSN BFCN RNA-seq LFC (x-axis) and BF RT-qPCR LFC (y-axis). (C) Bar graph represents ddCT of each gene normalized to 2N levels in the Fr Ctx. Significant downregulation was found for Mt-Atp8 and Mt-Rnr1 and trend-level downregulation was found for Mt-Cytβ and Mt-Cox2. (D) Correlation plot association between MSN BFCN RNA-seq LFC (x-axis) and Fr Ctx RT-qPCR LFC (y-axis). While most genes were not significantly downregulated by RT-qPCR, they trended in the same direction (downregulation). Sdha was the only gene that did not correlate with RNA-seq results. Black bars represent relative 2N expression and gray bars indicate Ts65Dn expression normalized to 2N for each gene (standard error of mean (SEM) is indicated by error bars). Key: *p < 0.05, **p < 0.01; t, trend.

