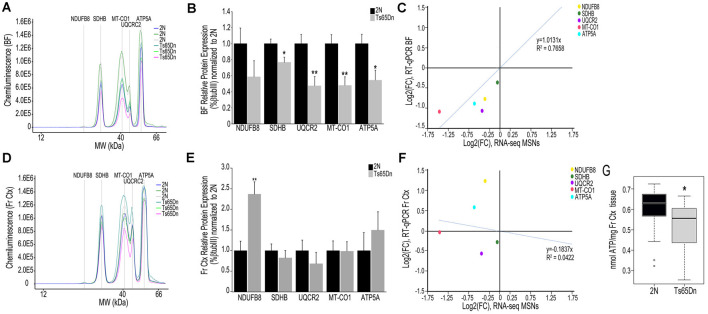
Figure 3.
Interrogation of oxidative phosphorylation Complex I-V subunit protein expression within the trisomic basocortical circuit. (A) Representative digital signatures of each assayed protein raw expression levels (y-axis) and molecular weight (x-axis) from Ts65Dn and 2N BF tissue homogenates. (B) Bar graph represents relative protein levels (normalized to beta-tubulin (βTubIII) as a percentage of 2N expression in BF tissue homogenates. Black bars represent 2N and gray bars indicate Ts65Dn (SEM indicated by error bars). (C) Correlation plot association between MSN BFCN RNA-seq LFC (x-axis) and BF protein level LFC (y-axis) indicating a high correlation. (D) Representative digital signatures of each assayed protein raw expression levels (y-axis) and molecular weight (x-axis) from Ts65Dn and 2N Fr Ctx tissue homogenates. (E) Bar graph represents relative protein levels (normalized to βTubIII) as a percentage of 2N expression in Fr Ctx tissue homogenates (SEM indicated by error bars). (F) Correlation plot association between MSN BFCN RNA-seq LFC (x-axis) and Fr Ctx protein level LFC (y-axis) indicating no significant correlation. (G) Box and whisker plots highlight downregulation of ATP levels in trisomic Fr Ctx. Key: *p < 0.05, **p < 0.01.

