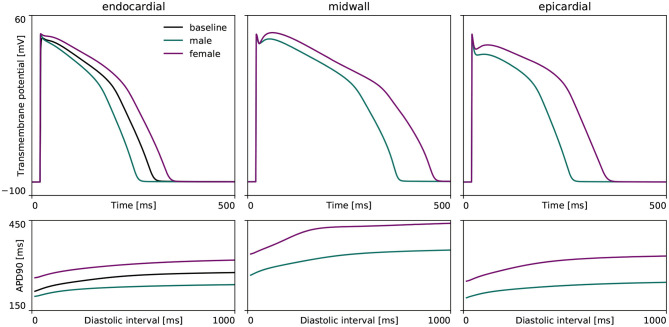
Figure 3.
Sex differences in transmural ventricular cardiomyocyte behavior. Sex-specific differences in endocardial, midwall and epicardial ventricular action potentials based on the experimentally quantified differences in ion channel activity. The green and purple lines represent the male and female steady state action potentials (Top) and action potential duration restitution curves (Bottom) for each transmural cell line. For the endocardial cell, the baseline steady-state action potential evolution and restitution curve of the calibrated and validated O'Hara-Rudy model for the 56% male / 44% female mixed-population is shown in black.

