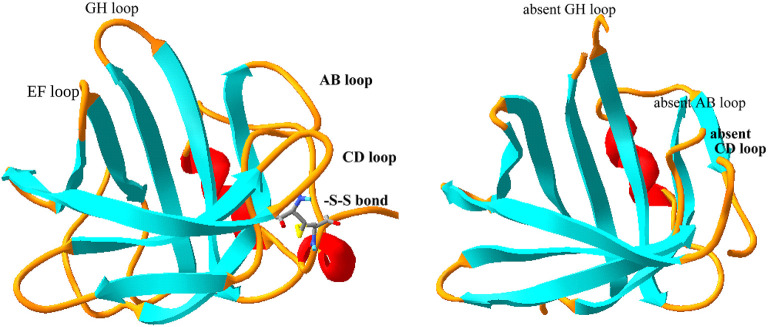
Figure 1.
Comparison of solution and crystal structure of tear lipocalin. The solution structure is shown on the left (Gasymov et al., 2001) and the crystal structure is shown on the right (Breustedt et al., 2005), PDB file, 1XKI. The loops (yellow) were evident from the solution structure, but were not resolved by the crystal structure. The strands or β sheets are shown in aqua and the α-helices are shown in red. The loops are named (black) by the adjoining strands for orientation.

