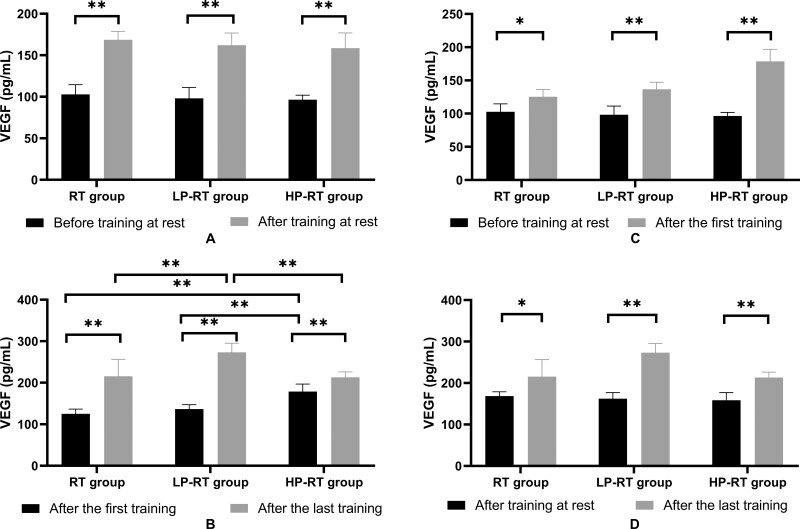
Figure 1.
(A) Plasma VEGF levels before training and after the last training in the resting state. (B) Plasma VEGF levels immediately after the first training and right after the last training. (C) Plasma VEGF levels before training in the resting state and immediately after the first training. (D) Plasma VEGF levels after the last training in the resting state and immediately after the last training. Data are presented as the mean±standard deviation. *p<0.05, **p<0.01, significantly different from baseline.

