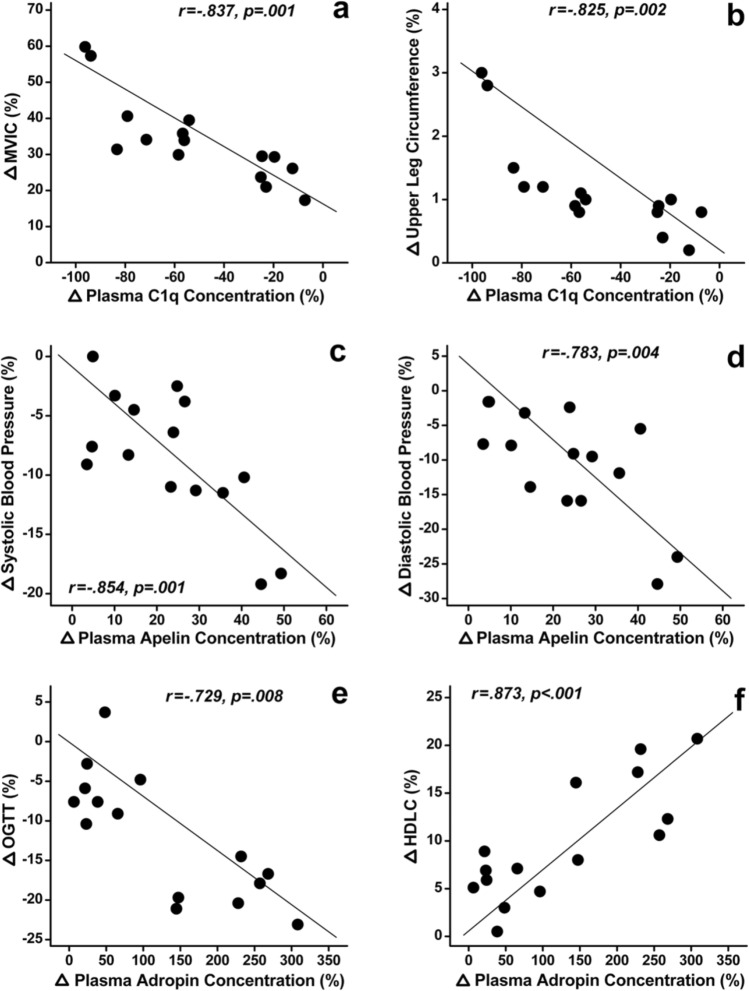
Figure 2.
Scatter plot graphs for some selected strong correlations in Table 1. Partial correlations between complement component 1q (C1q) concentration and the maximal voluntary isometric contraction strength of the knee extensors (∆MVIC) (a), upper thigh circumference (∆CIR) (b), apelin concentration and systolic blood pressure (∆SBP) (c), diastolic blood pressure (∆DBP) (d), adropin concentration and oral glucose tolerance test (∆OGTT) results (e), and high-density lipoprotein cholesterols concentration (∆HDLC) (f) for the participants in the descending stair walking (DSW) group (n = 15).

