Figure 5.
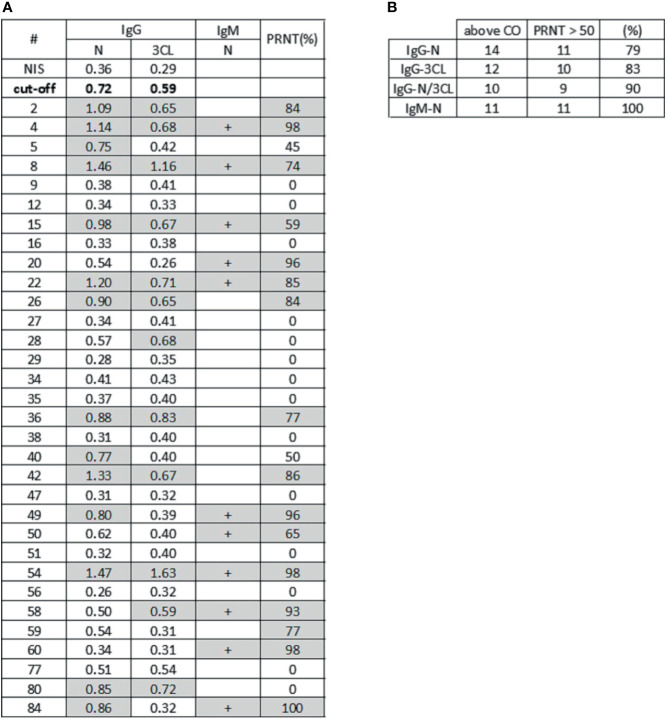
Serological profiling and virus neutralization. (A) The table shows absorbance signal for antiviral IgG reactive to N protein and 3CL protein by ELISA assay, IgM detection for N protein by LFA assay, and plaque reduction neutralization test (PRNT). Samples with absorbance signal above neutralization cutoff (twice NIS absorbance signal) for both antigens and samples with PRNT higher than 50% are highlighted in gray. (B) The table shows samples that exhibited high signal for antiviral antibodies to N protein (N), 3CL protease (3CL) and simultaneously (N and 3CL protein), in association to PRNT. In the “above CO” column, we have high IgG signal samples above the IgG positive cutoff (CO). The column PRNT>50 shows samples with neutralization activity higher than 50%. The last column shows the percentage of high neutralization samples that also have IgG signal above the cutoff, or IgM detected.

