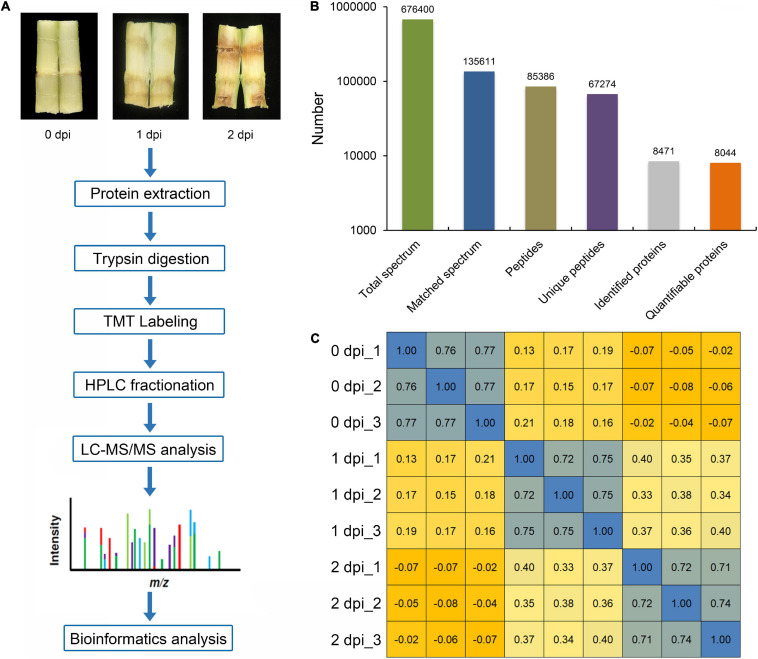
FIGURE 1.
Overview of treatments and proteome profiling. (A) Differentially expressed proteins (DEPs) were quantified and analyzed by tandem mass tag (TMT) labeling and LC-MS/MS. (B) Summary of sampled spectra, peptides, acetylated peptides, and identified proteins. (C) Pearson correlation statistics of the replicates of every experiment.

