FIGURE 1.
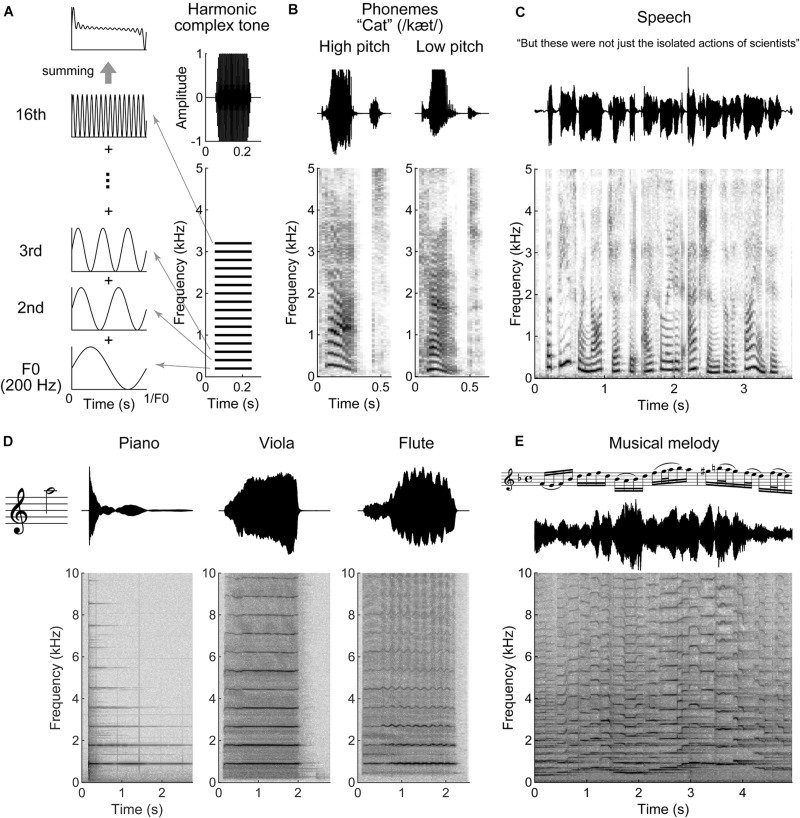
Harmonic structures in speech and music. (A) Schematic illustration of a harmonic complex tone comprised 200 Hz fundamental frequency (F0) with 16 harmonics (right bottom). The 16 harmonics are integer multiples of F0. The right top indicates a total amplitude waveform of the tone. The left panels show waveforms of F0, 2nd, 3rd, and 16th harmonics. The periodicity of the harmonic complex tone, the sum of all the harmonics (left top panel), is equal to F0. (B–E) Waveforms (top) and spectrograms (bottom) for a segment of speech and music. (B) Female (high pitch) and male (low pitch) voices pronouncing, “cat.” The harmonic structures are observed around the vowel “a” (æ). (C) A segment of speech. Syllables occur every ∼0.2 to 0.5 s (2–5 Hz). (D) The instrumental tones played by piano, viola, and flute at 880 Hz F0 (A5 note). Although the tones evoke the same pitch sensation, their timbre differs as indicated with the waveforms and spectrograms. (E) A segment of musical melody played by violin. The tone pitch fluctuates faster than speech in this example (it could be slower dependent on tempo and rhythm).

