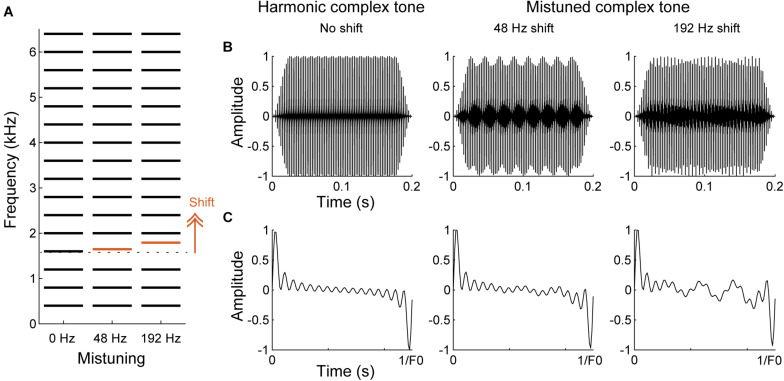
FIGURE 5.
Spectral and temporal cues in harmonic and mistuned complex tones. (A) Schematic of spectral structures of harmonic and mistuned complex tones comprised a F0 of 400 Hz with 16 harmonics. 4th harmonic (red) is shifted to higher frequencies for the mistuned complex tones by 48 or 192 Hz. (B,C) The waveforms of the complex tones shown in A for the overall tone duration (B) and for one cycle of the period of the harmonic complex tone (C). Due to the mistuned harmonic, additional temporal fluctuations emerge for the mistuned complex tones.

