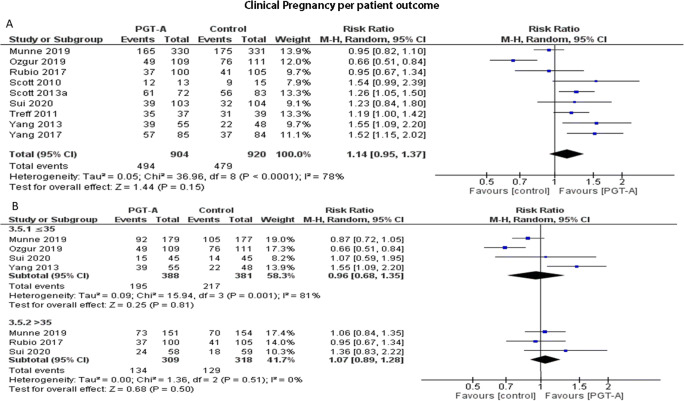
Fig. 6.
(A) Forest plot regarding the clinical pregnancy rate per patient outcome, comparing PGT-A to morphological evaluation (control), in the general population. (B) Forest plot regarding the clinical pregnancy rate per patient outcome, comparing PGT-A to morphological evaluation (control), in women of different age groups

