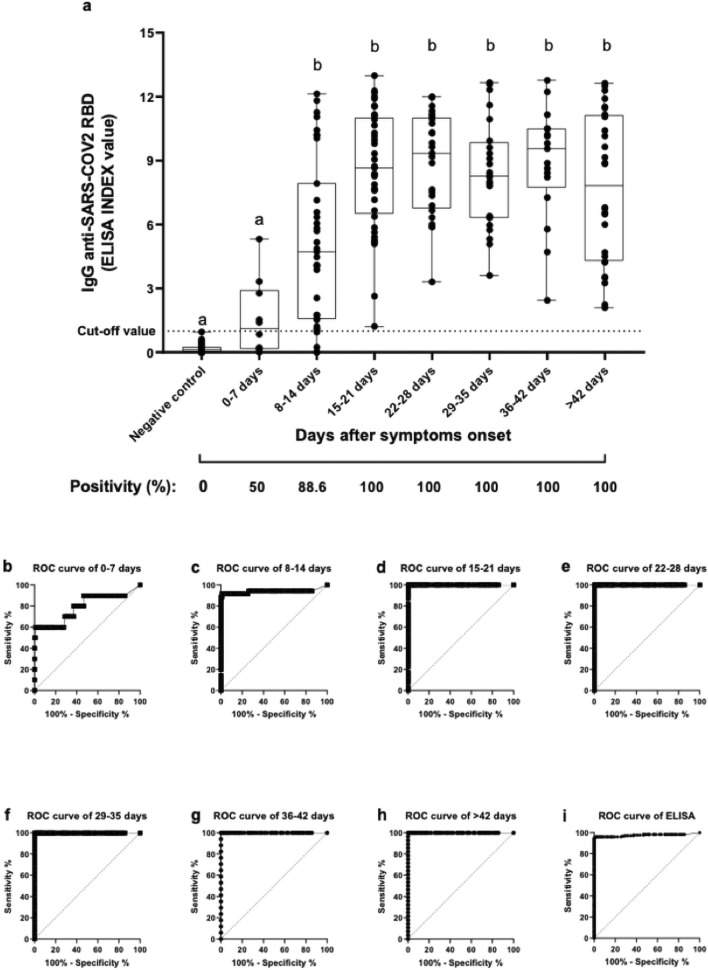
Figure 1.
RBD-specific IgG antibody levels in symptomatic patients with SARS-CoV-2. (a). Levels of antibodies against SARS-CoV-2 RBD in patients at different times after symptom onset in 176 samples from 47 patients. Negative samples to COVID-19 (118 samples) were used as a negative control of ELISA. The ELISA data were expressed as ELISA Index (EI). Aligned dot plots and boxplots show EI values (dots), medians (middle line), third and first quartiles (boxes), while the whiskers display the minimum and maximum values. The dashed line indicates the cut-off value. Different letters (a, b) indicate statistical differences between each time in comparison with negative control determined by Kruskal–Wallis and Dunn’s multiple comparisons test (P < 0.05). The positivity in each time was expressed as a percentage (%). (b–i) Receiver operating characteristic (ROC) curves show the RBD IgG-ELISA's diagnostic performance in each time analyzed.

