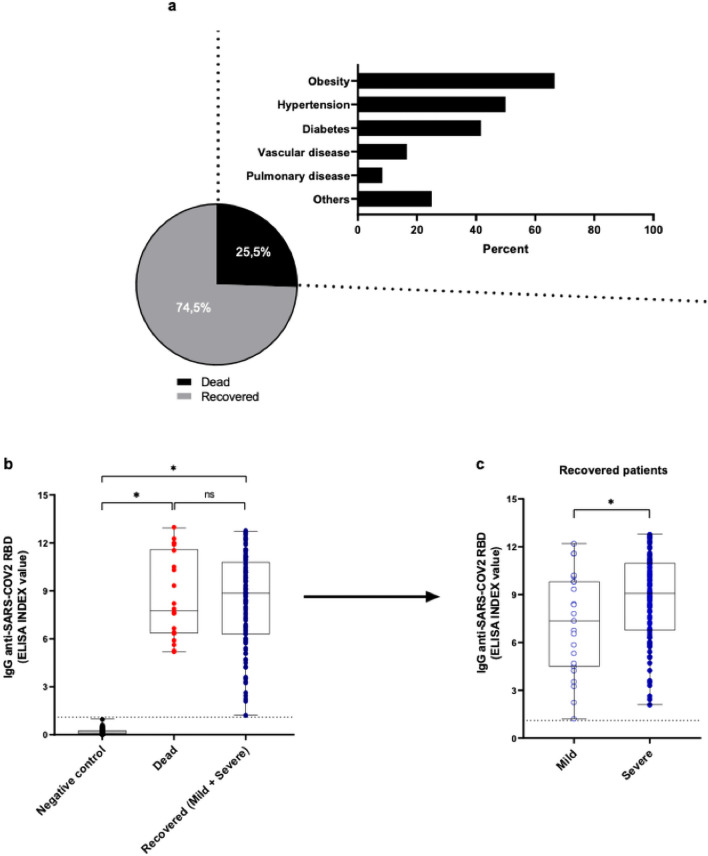
Figure 2.
IgG antibody levels to SARS-CoV-2 RBD in patients who recovered (mild or severe) or who died with COVID-19. (a) Percentage of patients who recovered or died of COVID-19 and main comorbidities disease-associated. A detailed description of other comorbidities was shown in Table 1. (b) Levels of antibodies to SARS-CoV-2 RBD in patients who recovered (blue) or died (red) of COVID-19 or negative controls (black) were expressed as EI. (c) Paired analysis of RBD-specific IgG levels in survived patients displayed mild and severe clinical presentation of COVD-19. Aligned dot plots and boxplots show EI values (dots), medians (middle line), third and first quartiles (boxes), while the whiskers display the minimum and maximum values. The dashed lines indicate the cut-off values. Statistically significant differences were determined by Kruskal–Wallis and Dunn’s multiple comparisons test or Mann–Whitney test when appropriate (*P < 0.05). Not significant (ns).

