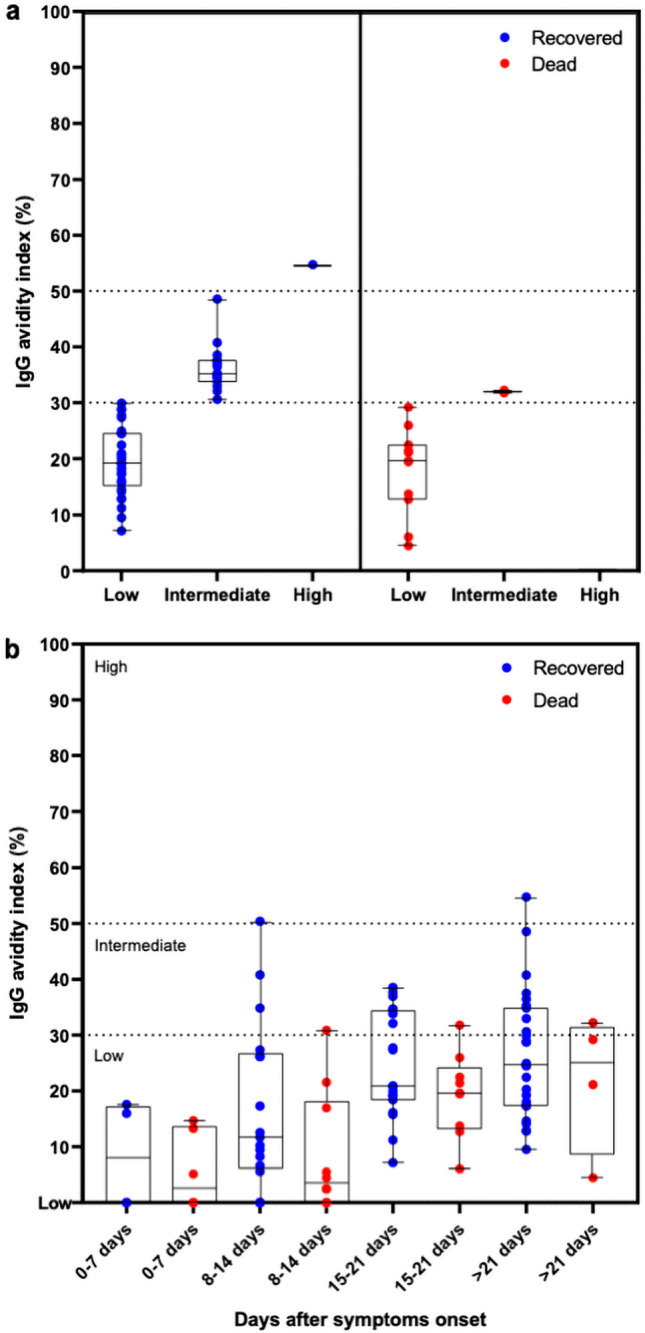
Figure 3.

Binding strength of IgG antibody to SARS-CoV-2 RBD (avidity) in COVID-19 patients. (a) IgG antibody avidity in patients who recovered (blue) or who died (red) with COVID-19. The IgG antibody avidity was expressed as the Avidity Index (AI %). The dash lines indicate the avidity range (low, intermediate, and high). (b) IgG antibody avidity to RBD concerning the time after symptom onset in recovered or dead groups. Aligned dot plots and boxplots show AI values (dots), medians (middle line), third and first quartiles (boxes), while the whiskers display the minimum and maximum values. Statistically significant differences were analyzed by Kruskal–Wallis and Dunn’s multiple comparisons test or Mann–Whitney test when appropriate (P < 0.05).
