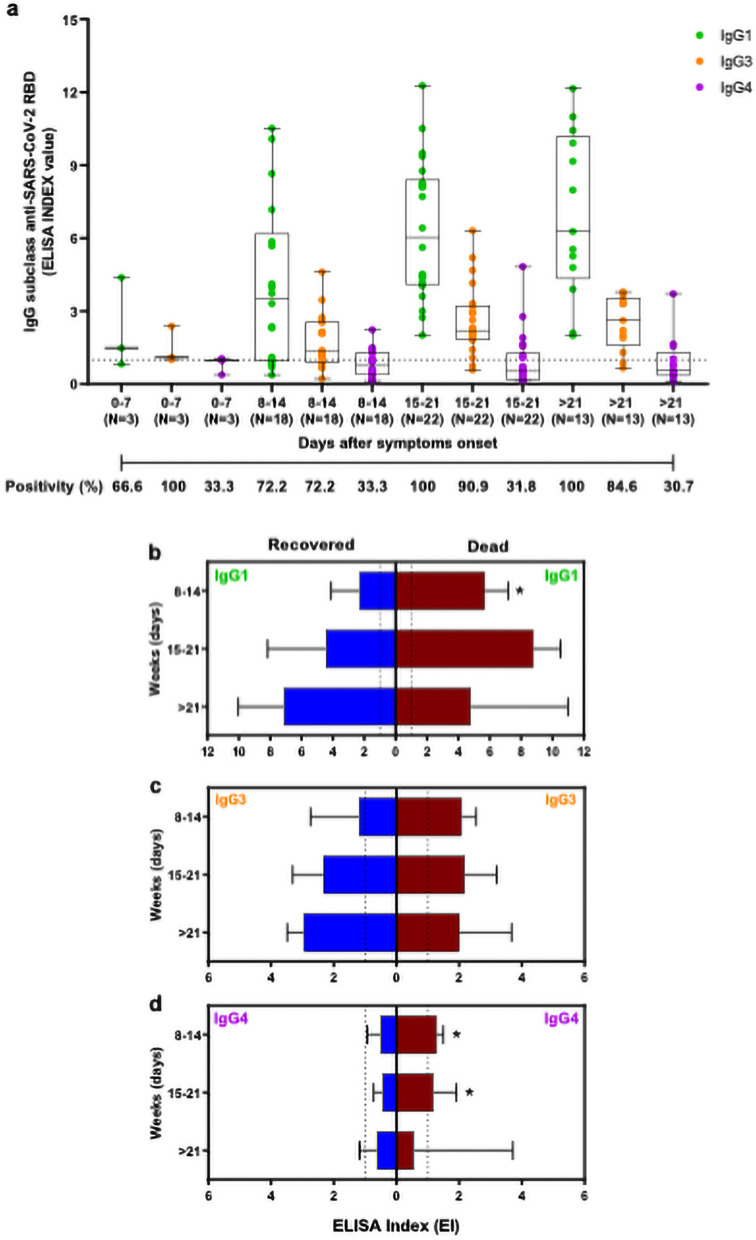
Figure 4.
Analyses of IgG subclasses to SARS-CoV-2 RBD in patients with COVID-19. (a) Kinetics of IgG1, IgG3, and IgG4 in COVID-19 patients in different time-points post the onset of the symptoms. The data were expressed as EI (dots), medians (middle line), third and first quartiles (boxes), while the whiskers display the minimum and maximum values. Numbers of patients (N) are indicated underneath. The positivity, in each time and respective IgG subclasses, was indicated as a percentage (%). Comparison of IgG1 (b), IgG3 (c), and IgG4 (d) in patients who recovered (blue) and who died (red) with COVID-19. Boxplots show the median of EI values and interquartile ranges. The dashed lines indicate the cut-off values. Statistically significant differences between groups were determined by the Mann–Whitney test each time (*P < 0.05).

