Figure 4.
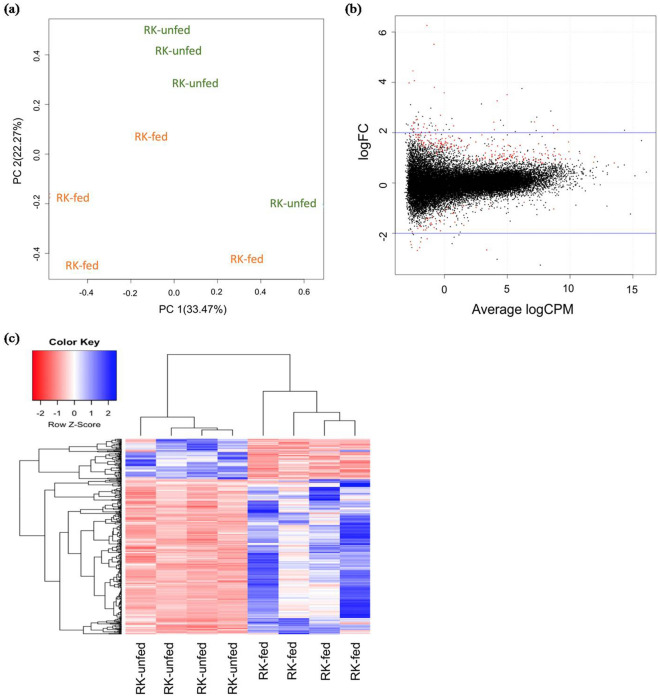
Differentially expressed genes (DEGs) in RK-fed, cuelure non-responding and RK-unfed, cuelure responding males. (a) Principal component analysis shows that colour-coded replicates show separation between conditions. (b) The expression profile of individual samples was explored with mean-difference (MD) plots. The differentially expressed genes are highlighted in red. The blue guidelines mark the log fold changes between ± 2. (c) Heatmap of all DEGs from all samples, with unsupervised hierarchical clustering on X and Y axes; drawn with coolmap function [https://rdrr.io/bioc/limma/man/coolmap.html] from bioconductor limma (3.48.1) package59. Clustering of samples was evident, as was clustering of genes that had correlated expression patterns.

