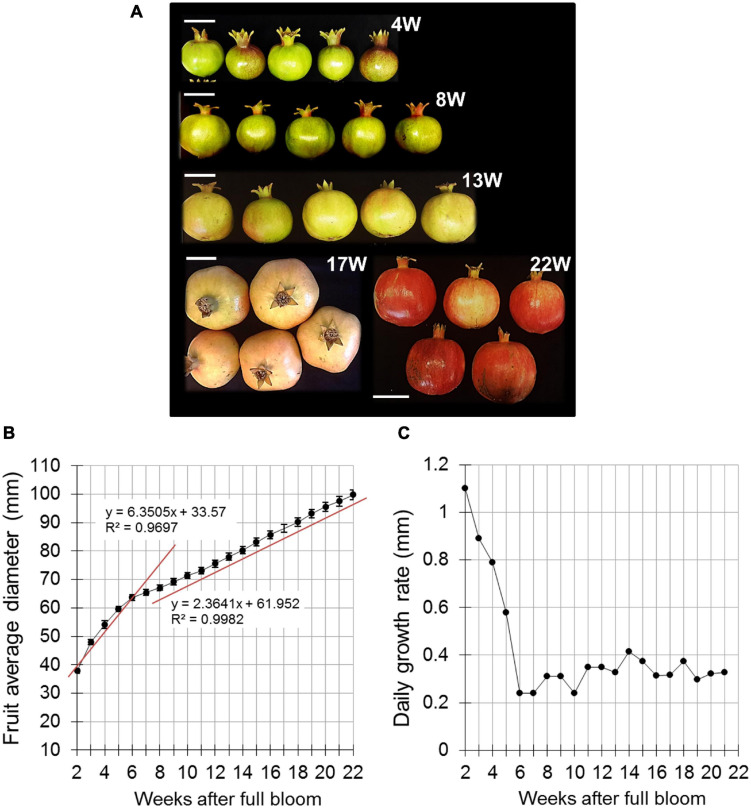
FIGURE 1.
Pomegranate fruit size and growth rate during fruit development in 2014. (A) Presentation of fruit developmental stages indicated as weeks after full bloom (W). Bar = 5 cm. (B) Fruit diameter was measured manually using a caliper. Data represent an average of 20 fruit with ± SE. Trend lines with R2-value were added separately to the first and second growth phases (4–6 and 7–22 weeks after full bloom, respectively). (C) Daily growth rate was calculated based on the data presented in (B).

