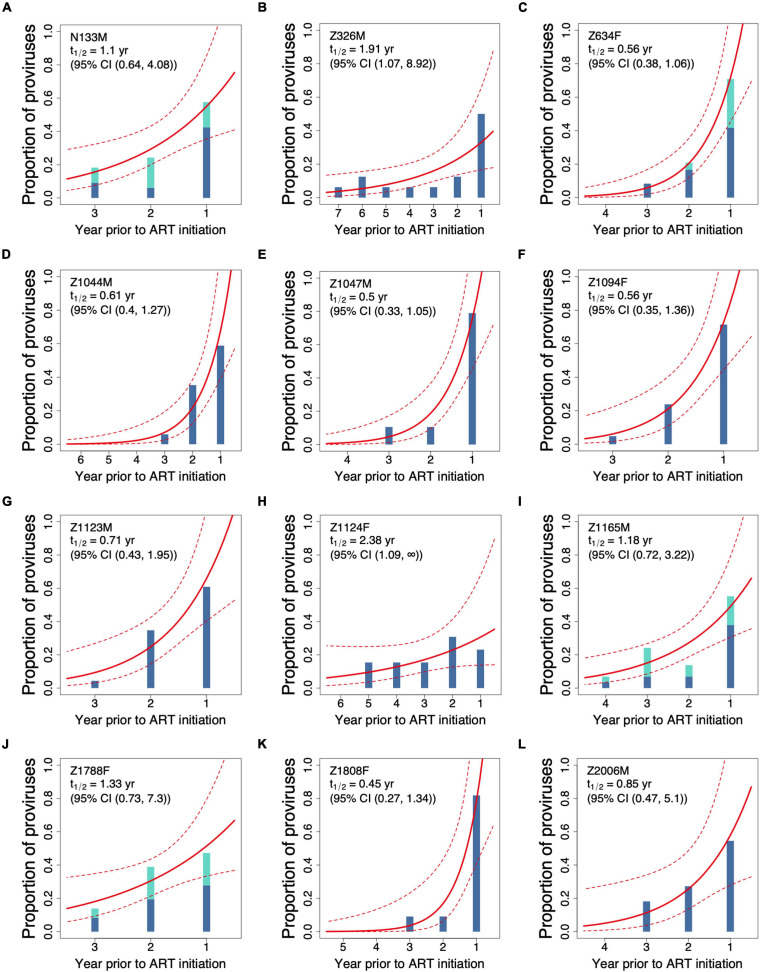
FIGURE 4.
Best-fitting proviral decay rates inferred from participants’ proviral compositions on ART (A–L). Each participant’s proviral distribution on ART, as determined phylogenetically via the procedure outlined in Figure 2, is depicted as histograms that show the proportions of proviruses remaining from each year of integration. For the four participants whose proviral pools were sampled twice on ART (N133M, Z634F, Z1165M, and Z1788F), proviral composition is shown as stacked bars. The solid and dashed red lines represent the best-fit half-life and associated 95% confidence intervals, respectively, estimated using a Poisson generalized linear model. Participants are sorted by study ID.

