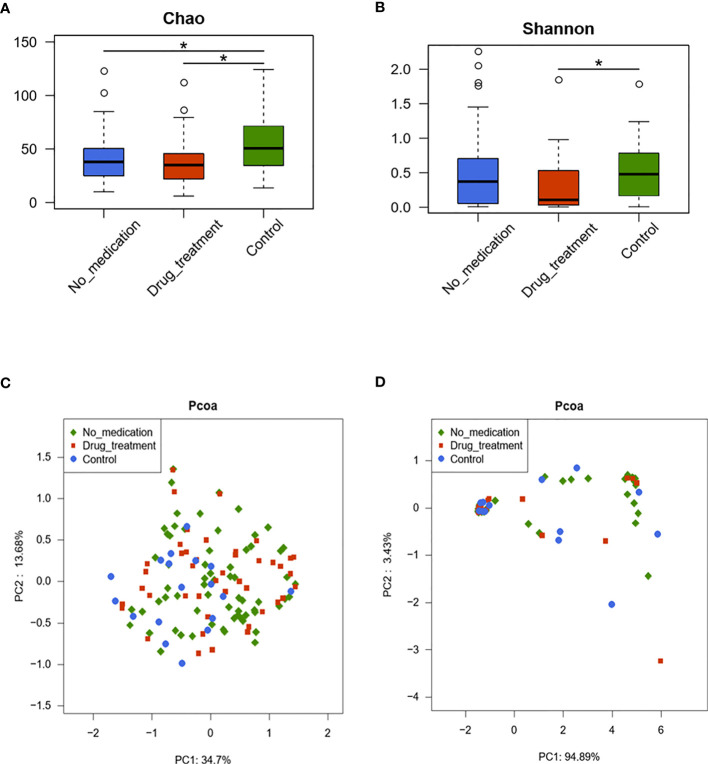
Figure 1.
The diversities of vaginal microbiota in the three groups are shown by the Chao index (A), Shannon–Wiener index (B), and principal coordinate analysis (PCoA) plot created based on the unweighted (C) and weighted (D) UniFrac distances. The values show the percentages of total community variation explained. (A, B) p-values were calculated using the one-sided Wilcoxon rank-sum tests. *p < 0.05.

