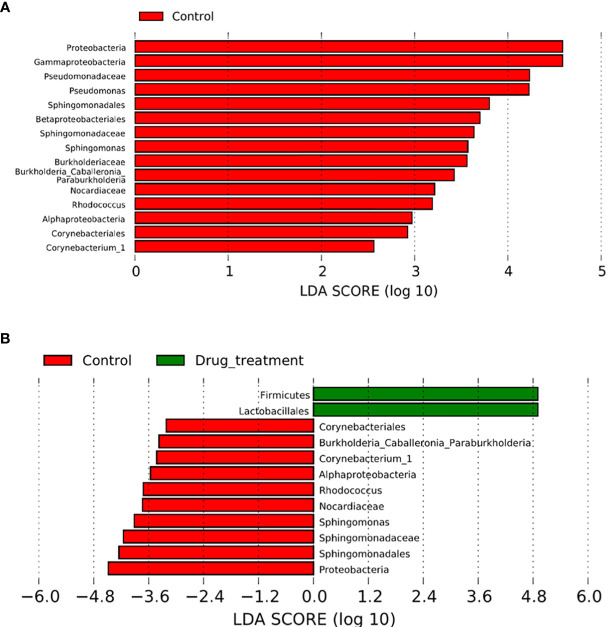
Figure 3.
Comparison between patients with recurrent spontaneous abortion (RSA) and controls. The effect size for each differentially abundant taxon was computed using linear discriminant analysis (LDA), which indicated its contribution to group differentiation. OTUs are presented in red and green when the taxa were significantly more abundant in the controls and RSA, respectively. (A) Differentially abundant vaginal taxa detected in patients not taking any medicine and controls. (B) Differentially abundant taxa detected in patients who did take medicine and controls.

