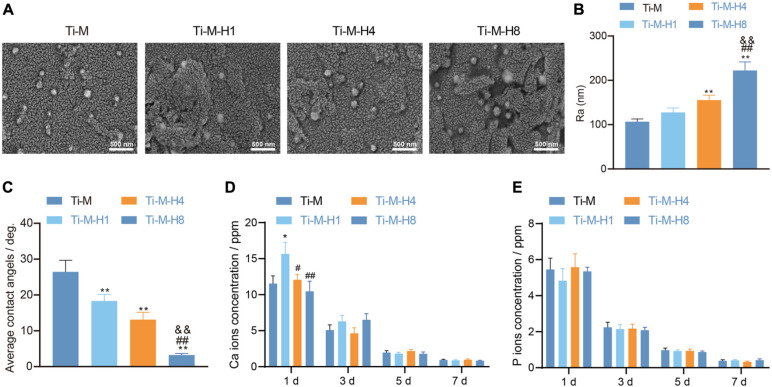
FIGURE 1.
Surface morphology and component characterization of Ti–M–H coatings. (A) Coating morphology via scanning electron microscopy. (B) Roughness analysis on the coating surface. (C) Sample surface wettability test. (D) Amount of Ca ion release after 1 day of immersion in phosphate-buffered saline. (E) The amount of P ion released after 1 day of immersion in PBS. *P < 0.05 compared with Ti–M. #P < 0.05 compared with Ti–M–H1. &P < 0.05 compared with Ti–M–H4. **P < 0.01 compared with Ti–M. ##P < 0.01 compared with Ti–M–H1. &&P < 0.01 compared with Ti–M–H4. The experiments were repeated three times.

