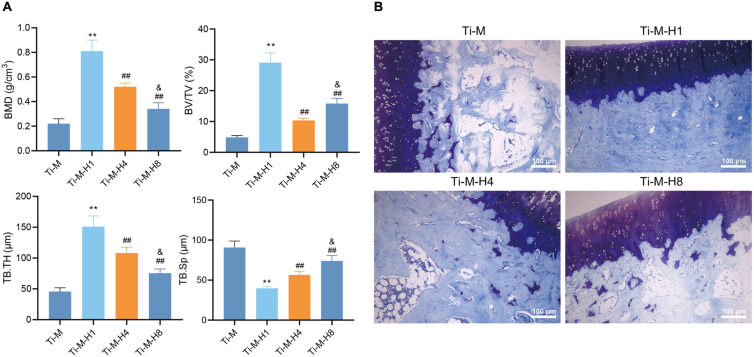
FIGURE 5.
Osteogenesis of in vivo implants. (A) The micro-architectural parameters displayed by the three-dimensional reconstructed μCT image, including bone mineral density, bone volume fraction, and trabecular thickness, and trabecular separation. (B) Images of toluidine blue staining. *P < 0.05 compared with Ti–M. #P < 0.05 compared with Ti–M–H1. &P < 0.05 compared with Ti–M–H4. **P < 0.01 compared with Ti–M. ##P < 0.01 compared with Ti–M–H1. &&P < 0.01 compared with Ti–M–H4. The experiments were repeated three times.

