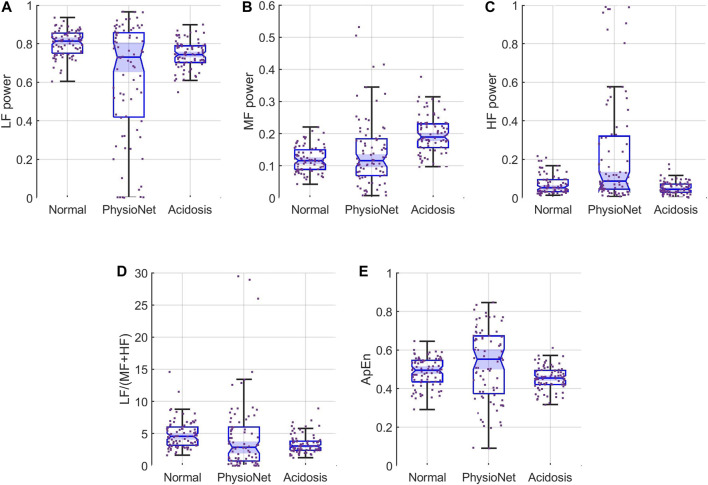
FIGURE 5.
Feature distributions for (A) LF, (B) MF, and (C) HF (D) LF/(MF + HF) ratio, and (E) ApEn. Each panel show the samples (scattered points) and boxplots for the features for simulated normal (left), the PhysioNet data (middle), and simulated acidosis features (right). The notches, or indentations, in each boxplot indicate the 95% CI for the median of each distribution. These plots show that the PhysioNet data and the simulated normal are not significantly different for any of the features. In contrast, the simulated acidosis distributions are significantly different for the MF and ApEn.

