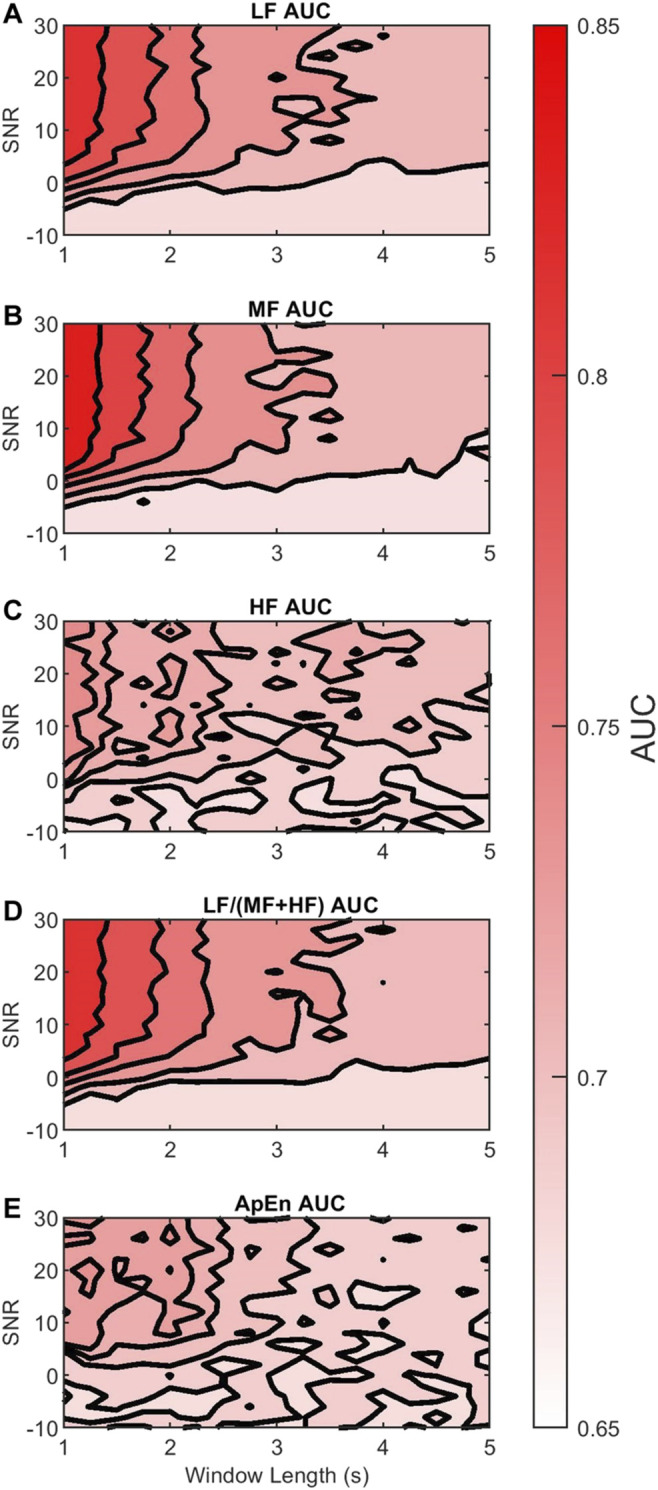
FIGURE 7.

Contour plots of the median of the (A) LF, (B) MF, (C) HF, (D) LF/(MF + HF), and (E) ApEn features for varying AC window length (horizontal axis) and SNR (vertical axis). The are coded in colors white (0.65), and red (0.85) according to their magnitude. For visualization, 5 isolines are used in each panel.
