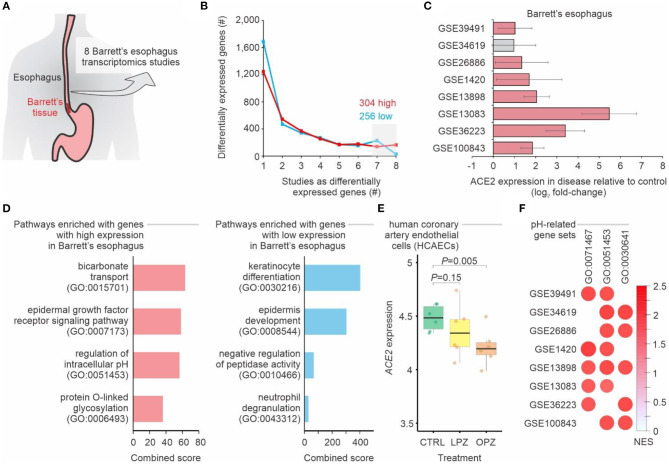
Figure 1.
Meta-analysis of gastroesophageal junction transcriptomes of patients with Barrett's esophagus. (A) Meta-analysis of 8 studies of Barrett's esophagus transcriptomes. (B) Number of differentially expressed genes in Barrett's esophagus compared with non-Barrett's esophagus. The lines show the number of genes (y-axis) considered up-regulated (red lines) or down-regulated (blue lines) in Barrett's esophagus (P-value < 0.05; log2 fold-change > 1; combined FDR <0.01) in one or more datasets (x-axis). The numbers of up-regulated and down-regulated genes in at least seven studies are indicated. (C) ACE2 is upregulated in patients with Barrett's esophagus. Each bar represents the log2 expression fold-change between patients and control individuals. The error bars indicate the 95% confidence interval. Bars in red represent a P-value < 0.05 and in gray a non-significant P-value. (D) Pathway enrichment analysis using the up-regulated and down-regulated genes in at least seven studies. The bars represent the combined score (x axis) calculated by Enrichr tool for selected Gene Ontology gene sets (y axis). (E) ACE2 expression in cells treated with proton pump inhibitors. Each boxplot represents the log2 expression of untreated (CTRL) cells and cells treated with either omeprazole (OPZ) or lansoprazole (LPZ). (F) Gene Set Enrichment Analysis (GSEA) of the 8 studies of Barrett's esophagus transcriptomes using pH-related gene sets. The size and color of the circles are proportional to the normalized enrichment score (NES) of the gene sets (columns) on each study (rows). The Gene Ontology IDs are indicated at the top.

