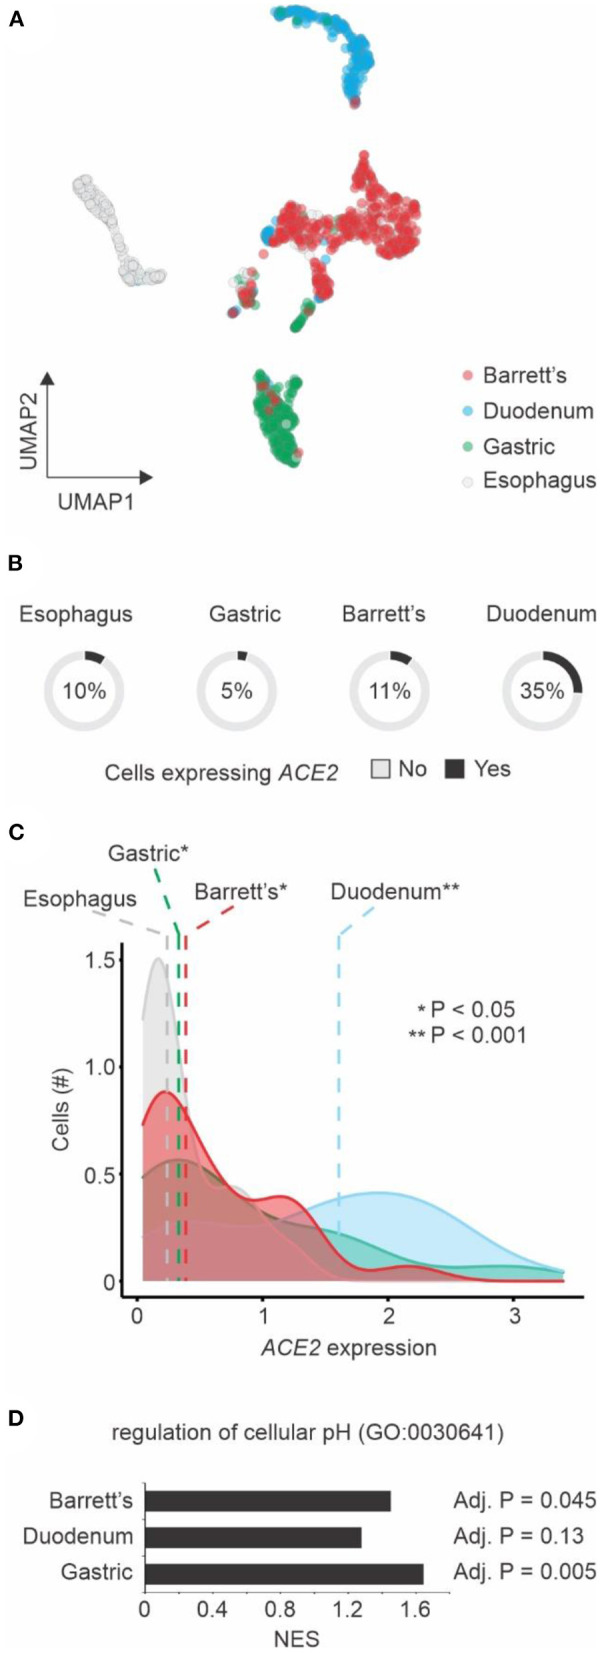
Figure 2.

Single cell transcriptomics of Barrett's esophagus. (A) Dimension reduction of single cells using Uniform Manifold Approximation and Projection (UMAP). Cells from four patients with Barrett's esophagus (n = 1,168) are shown. The colors represent the tissue types. (B) ACE2 expression by tissue type. The pie charts show the number of single cells with (black) or without (gray) ACE2 expression (expression values > 0). The fractions of ACE2-expressing cells are indicated. (C) Distribution of ACE2 expression by cells from different tissue types. The colors of histograms represent the tissue types. The dashed vertical line shows the median values of each tissue type. Student's t-test P-value between tissue types vs. esophagus is indicated. (D) Gene Set Enrichment Analysis (GSEA) of the three tissue types compared to esophagus using the regulation of cellular pH gene set. The normalized enrichment score (NES) are shown in the x-axis for each one of the tissue types. The adjusted P-value of the enrichment is displayed right next to the corresponding bar.
