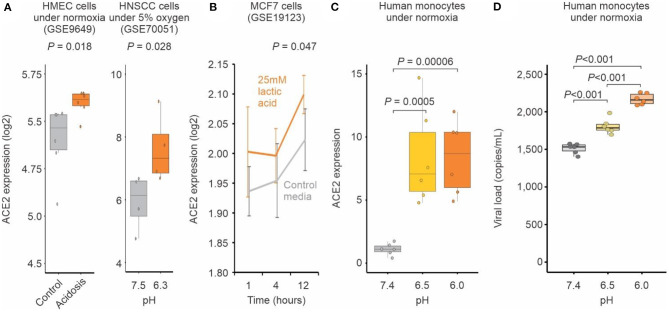
Figure 3.
Acidosis increases ACE2 expression and SARS-CoV-2 infection. (A) Human cells exposed to acidosis. Each boxplot represents the log2 expression of samples untreated (gray) or treated with lactic acidosis (brown) for two microarray studies (GSE9649 and GSE70051). Student's t-test P-values are indicated. (B) MCF7 cells exposed to pH reduction increases ACE2 expression. Gray and brown lines represent, respectively cells treated with control media or with 25 mM lactic acid for 1, 4, and 12 h (x-axis). Each point represents the mean log2 expression and the error bars the standard deviation of biological replicates. (C) Acid pH increases ACE2 expression in monocytes. Human peripheral blood monocytes were incubated in medium at three different pH (6, 6.5, 7.4) for 24 h. Each boxplot represents the fold change ACE2 expression. (D) Acid pH increases SARS-CoV-2 viral load. Human peripheral blood monocytes were incubated in medium at three different pH (6, 6.5, 7.4) for 24 h. The cells were infected with CoV-2 (MOI 0.1) for 1 h under continuous agitation. The RNA viral load was measured by qPCR.

