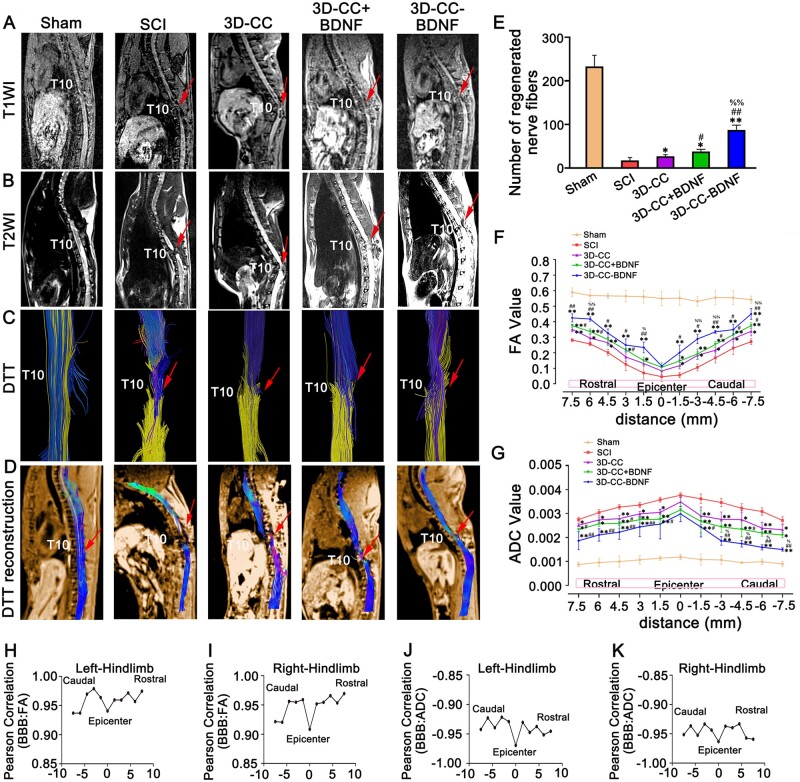
Figure 5.
Magnetic resonance imaging (MRI) and diffusion tensor imaging (DTI) at 8 weeks after SCI. (A–D) Representative T1-weighted images (A), T2-weighted images (B), diffusion tensor tractgraphy (DTT) images (C) and DTT reconstruction images (D). (E) The number of regenerated nerve fibers at the injury site. (F–G) FA value distribution map (F) and ADC value distribution map (G) of the corresponding location at the injury site. (H–K) Corresponding Pearson correlation coefficient values (R) at all locations for (BBB versus FA and BBB versus ADC) of left hindlimb (H, J) and right hindlimb (I, K) were plotted. All red arrows indicated the injury/graft site located at T10 spinal cord segment. *P < 0.05, **P < 0.01 vs SCI group. #P < 0.05, ##P < 0.01 vs 3D-CC group. %P < 0.05, %%P < 0.01 vs 3D-CC+BDNF group. n = number of animals under each condition (n is expressed as dots in the bars); in A–K, n = 15.

