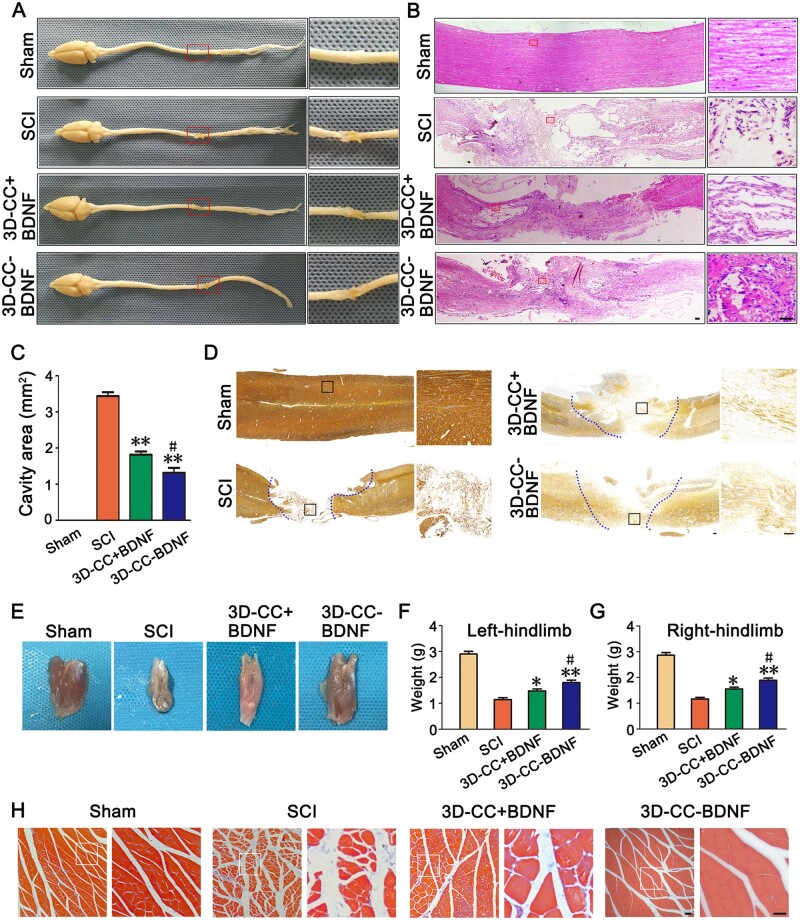
Figure 6.
Histological analysis for four groups. (A) Macroscopic histology images of spinal cord. Low magnification of spinal cord sections (left) and higher magnification of the red boxed sections (right). (B) Typical HE staining images. Low magnification (50×) of spinal cord sections (left) and higher magnification (400×) of the red boxed sections (right). (C) Cavity area of spinal cord injury area in HE staining image. (D) Representative Bielschowsky’s silver staining images. The image on the right was an amplified image of the black box in the image on the left. (E) Macroscopic histology images of the gastrocnemius muscle. (F–G) The weight of the gastrocnemius muscle of left hindlimb (F) and right hindlimb (G). (H) Representative Masson’s trichrome staining images of the gastrocnemius muscle. Low magnification (100×) of gastrocnemius muscle sections (left) and higher magnification (200×) of the white boxed sections (right). *P < 0.05, **P < 0.01 vs SCI group. #P < 0.05 vs 3D-CC+BDNF group. Scale bars = 50 µm in panels (B, D, H). n = number of animals under each condition (n is expressed as dots in the bars); in A–H, n = 15.

