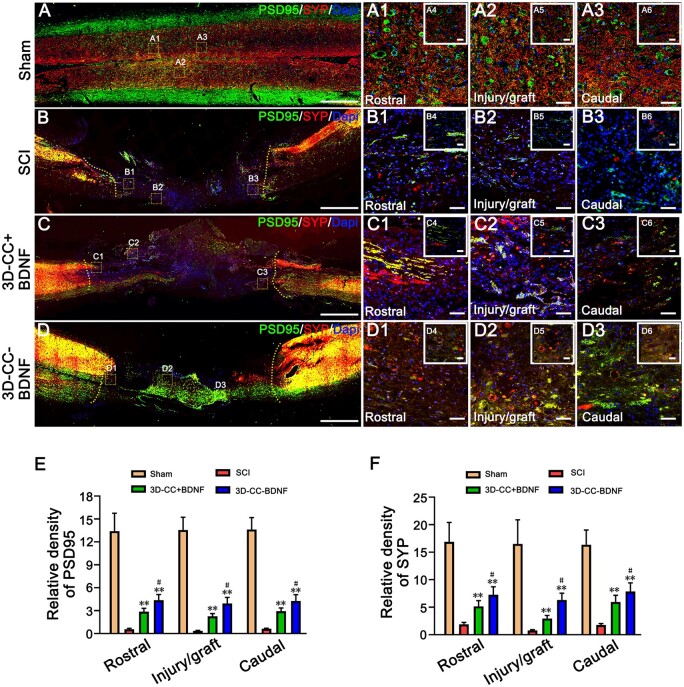
Figure 8.
The establishment of synaptic connections at 8 weeks post-surgery. (A–D, A1–A3, B1–B3, C1–C3, D1–D3) The typical images of PSD95-positive (green) and SYP-positive (red) synaptic-like structures immunofluorescence staining in longitudinal sections of spinal cord. (A1–A3), (B1–B3), (C1–C3) and (D1-D3) were an amplified image of the yellow box in (A–D), respectively, demonstrating the PSD95-positive staining and SYP-positive staining in the rostral area, the injury/graft site and caudal area of spinal cord. (A4–A6), (B4–B6), (C4–C6) and (D4–D6) were larger magnified images of the yellow box in (A–D). (E, F) The quantification of the relative density of PSD95 (E) and SYP (F) in the rostral area, the injury/graft site and caudal area of spinal cord. **P < 0.01 vs SCI group. #P < 0.05 vs 3D-CC+BDNF group. Scale bars = 500 µm in panels (A–D), 50 µm in panels (A1–A3, B1–B3, C1–C3, D1–D3), 20 µm in panels (A4–A6, B4–B6, C4–C6, D4–D6). n = number of animals under each condition (n is expressed as dots in the bars). In A–F, n = 15.

