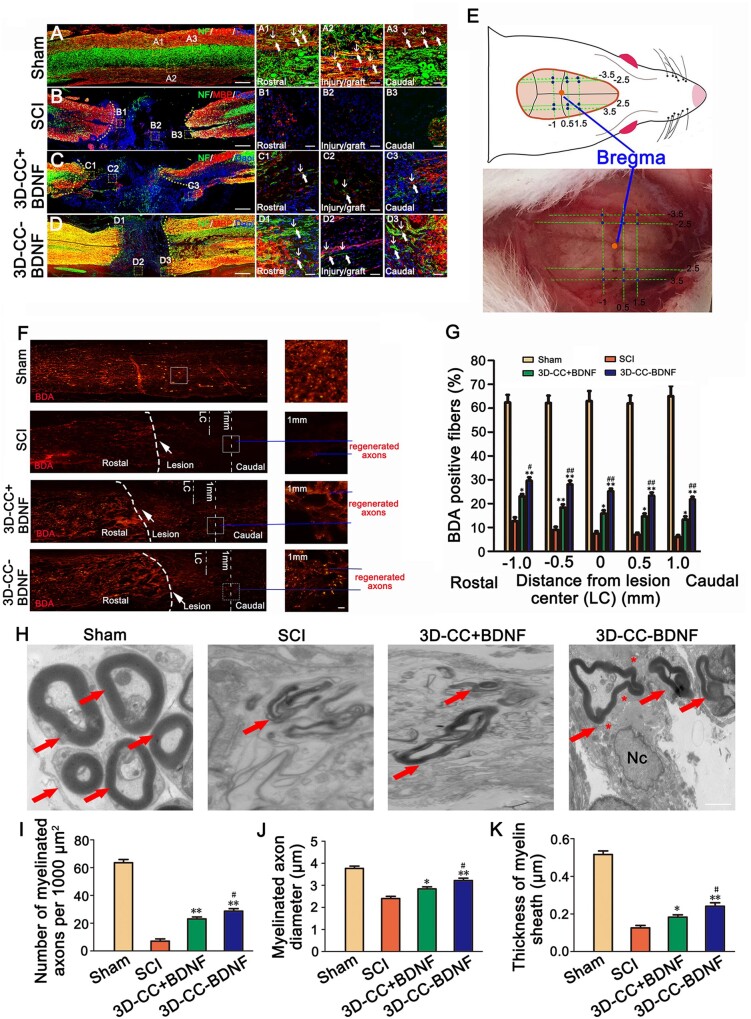
Figure 9.
Myelination in the injury/graft site of spinal cord, the results of BDA tracing and the TEM images at the injury site. (A–D, A1–A3, B1–B3, C1–C3, D1–D3) The typical images of NF-positive nerve fibers (green, white arrow) and MBP positive myelin-like structures (red, white arrow) immunofluorescence staining in longitudinal sections of spinal cord. (A1–A3), (B1–B3), (C1–C3) and (D1–D3) were an amplified image of the yellow box in (A–D), respectively, demonstrating the NF-positive staining and MBP-positive staining in the rostral area, the injury/graft site and caudal area of spinal cord. (E) The image showed the 12 positions of the injection BDA (blue dot) and the position of Bregma (yellow dot). (F) The representative images of BDA staining (red) in longitudinal sections of spinal cord. Low magnification (50×) of spinal cord sections (left) and higher magnification (200×) of the white boxed sections (right). The white arrow pointed out the lesion. The blue line indicated the regenerated axons. (G) The quantification of BDA positive CST fibers staining at −1 mm, −0.5 mm, 0 mm, 0.5 mm and 1 mm distance caudal to the lesion center. (H) Representative transmission electron micrographs at the injury site. All red arrows showed myelinated nerve fibers. All asterisks indicated unmyelinated nerve fibers. Nc = nucleus. (I–K) The quantification of the number of myelinated axons (I), myelinated axons diameter (J) and thickness of myelin sheath (K) at the injury site. *P < 0.05, **P < 0.01 vs SCI group. #P < 0.05, ##P < 0.01 vs 3D-CC+BDNF group. Scale bars = 500 µm in panels (A–D), 50 µm in panels (A1–A3, B1–B3, C1–C3, D1–D3, F), 1 µm in panel (H). n = number of animals under each condition (n is expressed as dots in the bars). In A–D, n = 15; In E–G, n = 5; In H–K, n = 5.

