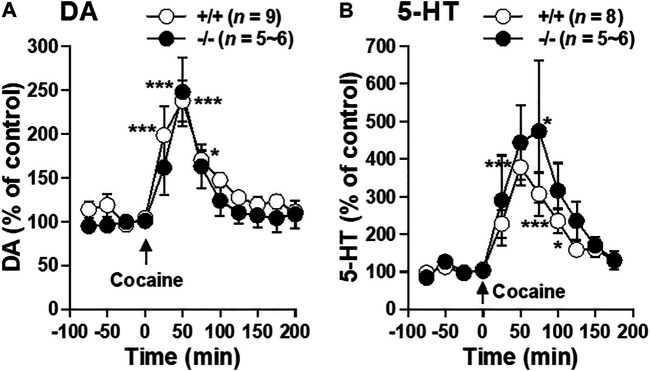
FIGURE 6.
Cocaine-evoked DA and 5-HT releases in the striatum of FFAR1+/+ and −/− mice. At time 0 min. a single i.p. injection of cocaine (20 mg/kg) was given. The figures show mean percentage changes from baseline DA (A) and 5-HT (B) values. *p < 0.05, ***p < 0.001 versus the basal values at time 0 min of the same genotype (one-way ANOVA followed by Dunnett’s post hoc test).

