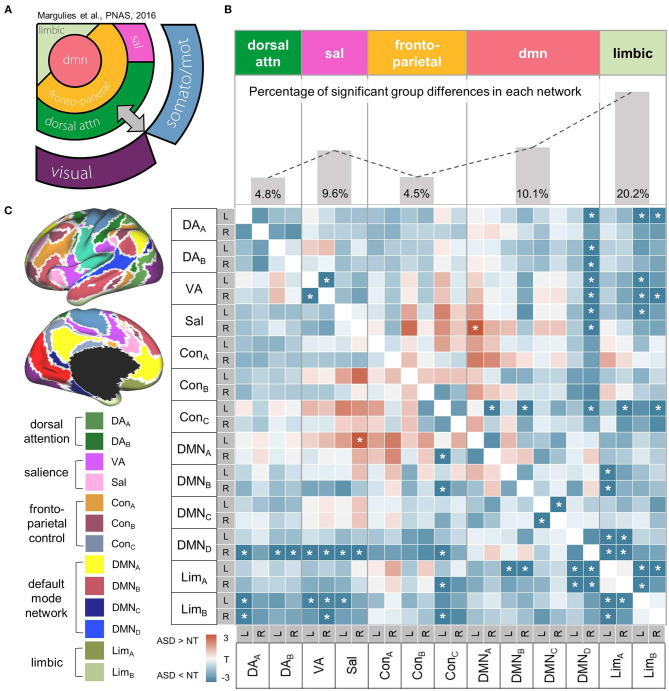
Figure 3.
Within-high-order transmodal network. (A) A schematic diagram showing the hierarchical relationships of canonical resting-state networks. The figure component adapted from Margulies et al. (55). (B) Top. The proportion of altered connectivity in ASD shows an increasing trend along the hierarchy of high-order networks that was aligned based on the schematic diagram on the left. Bottom. A heatmap representing correlation coefficients of intrinsic functional connectivity (iFC) within high-order networks. Markedly decreased iFC in ASD suggests a less integrated high-order transmodal system. Significant group differences in iFC between ASD and NT are shown with asterisks (FDR = 0.05). (C) High-order network parcels were derived from the Yeo-Krienen 17 resting state networks (68). DA, dorsal attention network; VA, ventral attention network; Sal, salience network, Con, frontoparietal control network; DMN, default mode network; Lim, limbic network.

