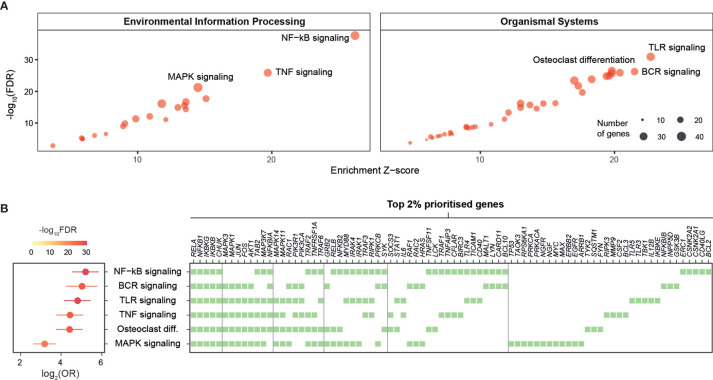
Figure 2.
Prioritization of target pathways in kidney stone disease. Pathway-level prioritization was based on enrichment analysis of the top 2% prioritized genes using a collection of KEGG pathways, with the enrichment Z-score, the significance level (FDR), odds ratio (OR), and 95% confidence intervals estimated according to Fisher’s exact test (one-sided). BCR, B-cell receptor; MAPK, mitogen-activated protein kinase; TLR, toll-like receptor; TNF, tumor necrosis factor. (A) Scatter plots illustrating prioritized pathways, with the top 3 displayed separately for environmental information processing pathways (left) and organismal systems pathways (right). Each dot represents an individual pathway and is sized by the number of member genes thereof. (B) Forest plots of the top 6 prioritized pathways (left), with member genes illustrated using a heatmap (right) in which genes are shown at the top and ordered by frequency of occurrence (colored square).

