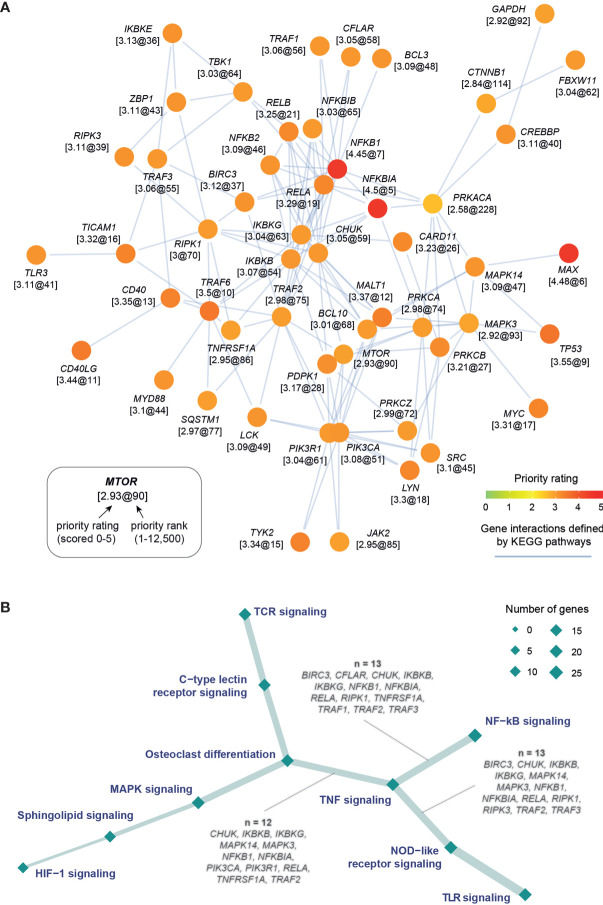
Figure 3.
Target pathway crosstalk identified in kidney stone disease. (A) Gene-centric representation of the crosstalk, with nodes for genes and edges for interactions between nodes. Node are labelled by gene symbols along with the priority information (formatted as “rating@rank”) and colored by priority rating. This crosstalk was identified to contain highly prioritized interconnecting genes from a network of gene interactions (obtained by merging KEGG pathways). (B) Pathway-centric representation of the crosstalk, with nodes for pathways (sized by the number of member genes) and edges for connections (the thickness proportional to the number of genes shared between two-endpoint pathways). Also labeled in the edges are shared genes between the TNF signaling and the other endpoint as indicated.

