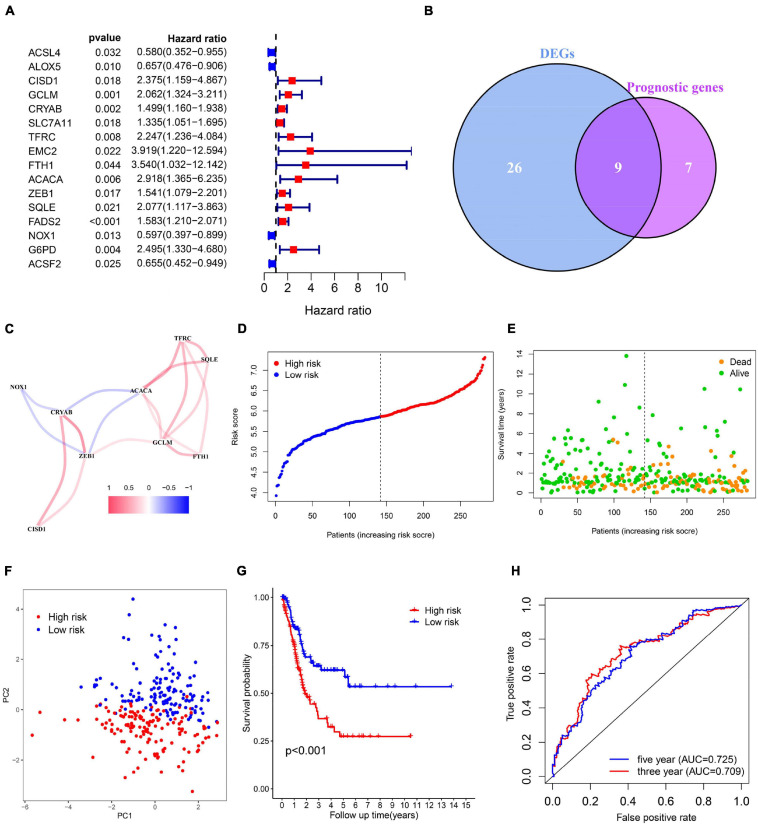
FIGURE 2.
Identification of bladder cancer-specific ferroptosis-related genes and construction of the prognostic model. (A) Forest plots based on univariate survival analysis in patients with BC. (B) Venn diagram for overlapping genes among differentially expressed genes (DEG) correlated with patient outcome. (C) The correlation network of candidate genes. (D–F) Risk score distribution, overall survival (OS) status and PCA plot of high and low risk BC cases in the TCGA data. (G) Kaplan-Meier survival curves of patients in BC groups of different risk score in the TCGA cohort. (H) Time-dependent ROC curves of overall survival at 3- (red) and 5-years (blue).

