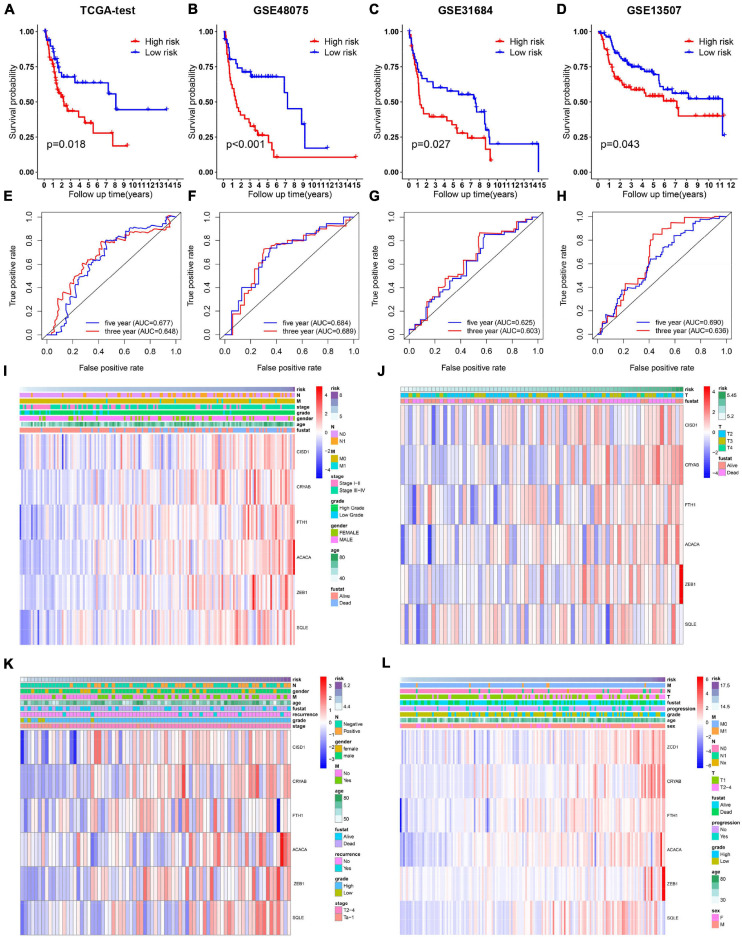
FIGURE 3.
Validation of the 6-gene signature model in the internal TCGA and another indicated three independent public datasets. (A–D) Kaplan-Meier survival curves for bladder cancer patients based on risk score in TCGA, GSE48075, and GSE31684, and GSE13507 datasets. (E–H) ROC curve analysis for predicting 3- and 5-year overall survival in the above four BC cohorts. (I–L) Heatmaps showing the expression level of 6 selected ferroptosis-related genes ranked by risk score in the above four BC cohorts.

