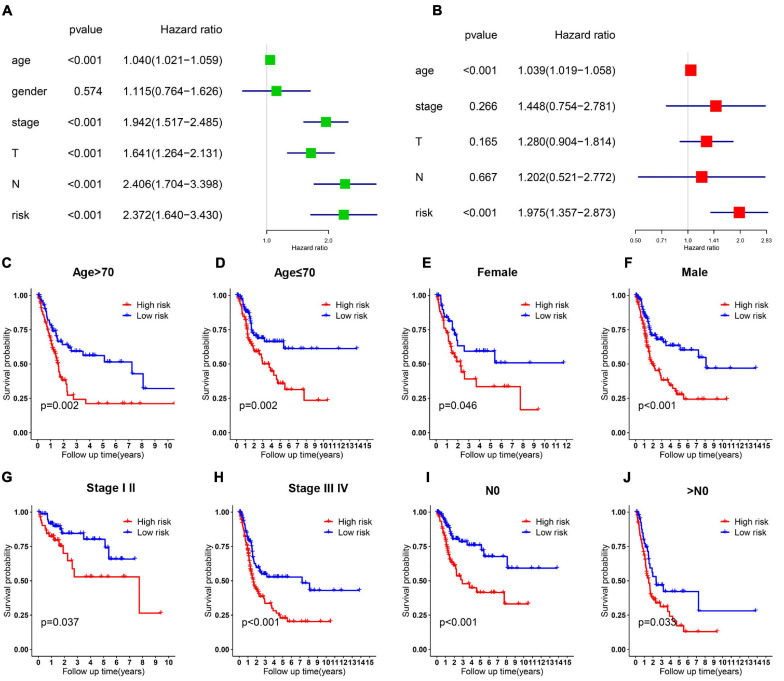
FIGURE 4.
Cox regression and stratified analysis of the 6 gene risk model. (A,B) Results of univariate and multivariate regression analysis of the relation between clinical features and risk model. (C–J) Kaplan–Meier survival curves for bladder cancer patients with age (C,D), gender (E,F), stage (G,H), and N metastasis (I,J).

