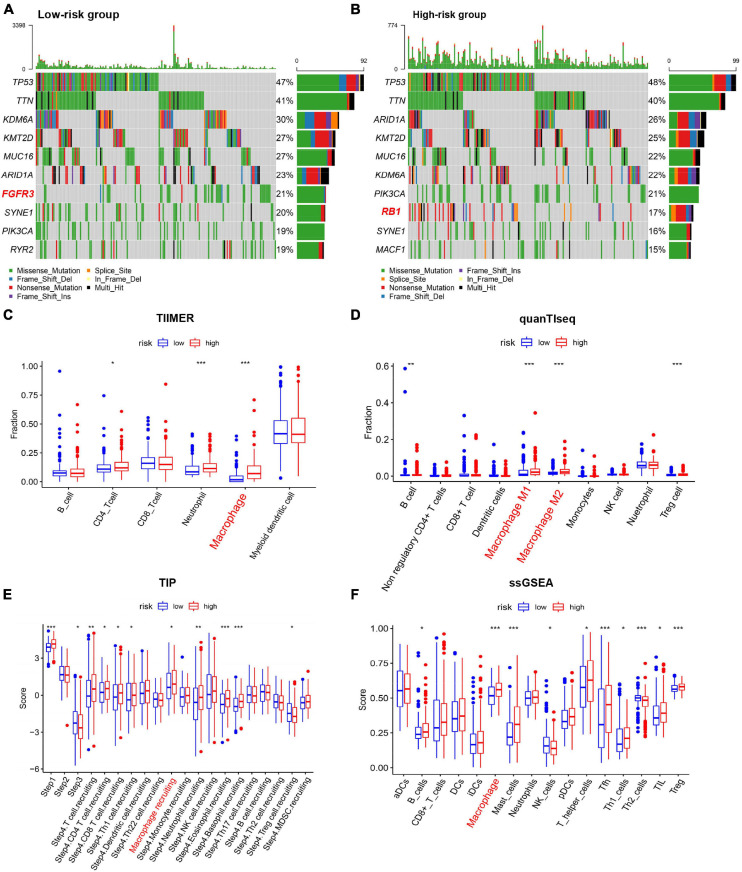
FIGURE 6.
Characterization of immune cell infiltration and mutation landscape in BC tissues among different risk groups. (A,B) Somatic mutation profiles of BC tissues among different risk groups. (C–F) Boxplots of Immune cell infiltration with high and low risk scores estimated using TIMER, quanTIseq, TIP, and ssGSEA. *p < 0.05, **p < 0.01, ***p < 0.001.

