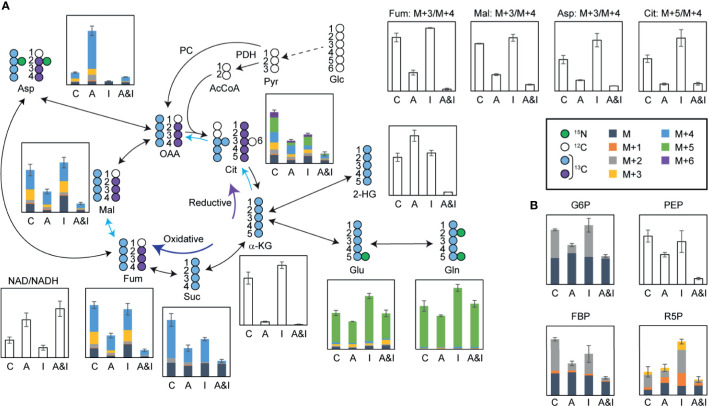
Figure 5.
In-depth metabolic flux analysis and data mining reveal that extensive disruption of cells metabolism following treatment contributes to the synergy between IACS-010759 and AC220. U937 cells were treated with 500 nM AC220 and/or 5 nM IACS-010759 for 24 h. Relative metabolite levels are overlayed on a schematic representation of the flux of isotopically labeled (A) glutamine (13C5, 15N2-glutamine) through the TCA cycle or (B) 1,2-13C2-glucose through glycolysis and pentose phosphate pathway. Blue arrows highlighting specific TCA cycle reactions indicate metabolic reactions with Cohen’s d-values lower than -0.8. Shaded bars show 13C enrichment fractions; empty bars show total pool intensities or total pool intensity ratios, or isotope intensity ratios (average of three replicates). Error bars represent standard deviations (n=3). C, control; A, AC220; I, IACS-010759; A&I, AC220+IACS-010759; Glc, glucose; Pyr, pyruvate; PDH, pyruvate dehydrogenase; AcCoA, acetyl CoA; PC, pyruvate carboxylase; OAA, oxaloacetate; Cit, citrate; α-KG, alpha-ketoglutarate; Glu, glutamate; Gln, glutamine; Suc, succinate; Fum, fumarate; Mal, malate; Asp, aspartate; NAD, oxidized form of nicotinamide adenine dinucleotide; NADH, reduced form of nicotinamide adenine dinucleotide; G6P, glucose 6-phosphate; PEP, phosphoenolpyruvate; FBP, fructose 1,6-bisphosphate; R5P, ribose 5-phosphate.

