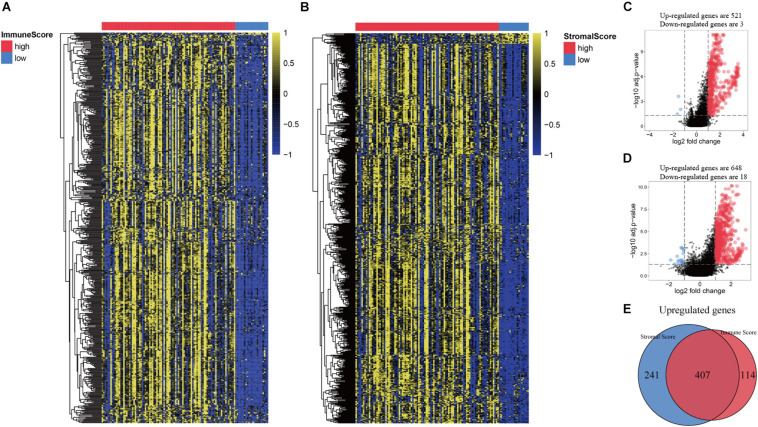
FIGURE 2.
Comparison of gene expression profiles based on immune score and stromal score in recurrent HNSCC. (A) Heat map of genes that are significantly expressed differently based on immune scores. (B) Heat map of genes that are significantly differently expressed based on stromal scores. (C) Volcano map of differential expressed genes (DEGs) according to the immune score. (D) Volcano map of DEGs according to the stromal scores. (E) Venn diagram analysis of abnormally expressed genes according to the immune and stromal scores.

