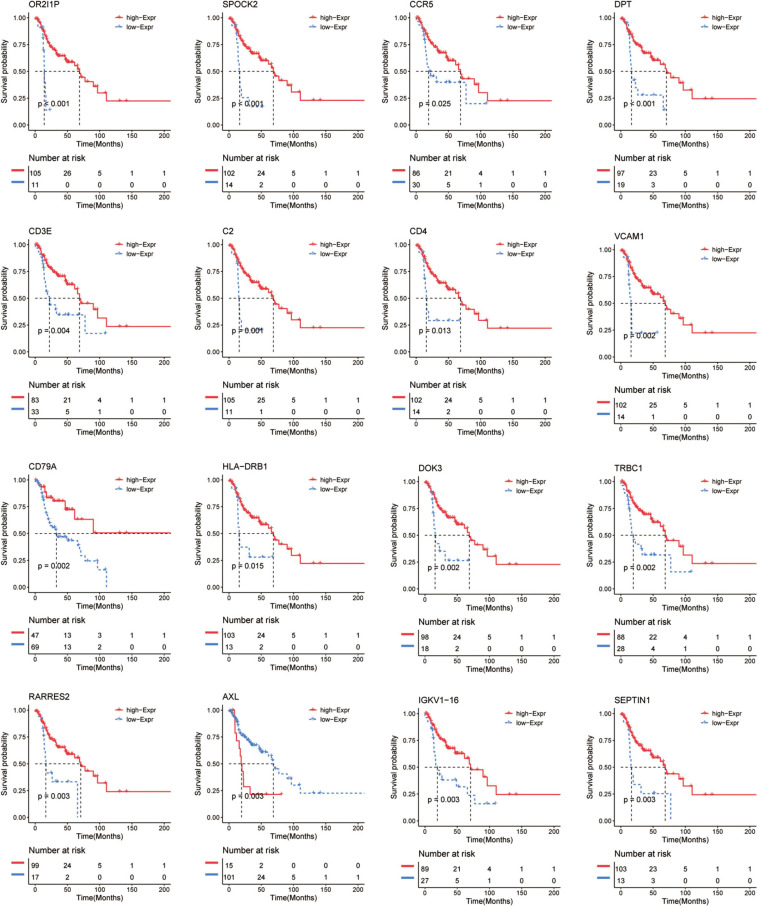
FIGURE 5.
Kaplan–Meier survival curve shows the survival analysis of immune-related genes in recurrent HNSCC. The expression level of 16 immune-related genes to affect the overall survival are selected randomly, and compare the overall survival of the high and low gene expression groups. The red and blue dashed lines represent the upper and lower limits of the 95% confidence interval for gene expression, respectively.

