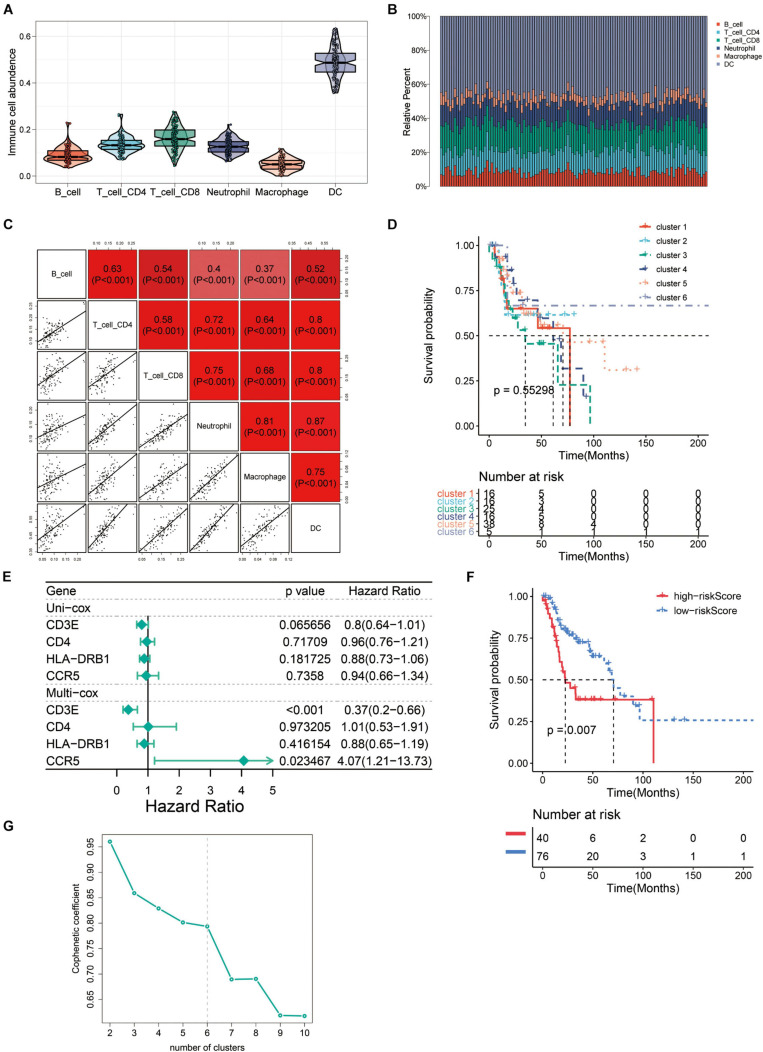
FIGURE 6.
The immune landscape of recurrent HNSCC tumor microenvironment (TME). (A) Abundance of immune infiltrating cells in recurrent HNSCC. (B) Stacked bar graph of samples arranged in the order of cluster assignment, and unsupervised clustering of all samples based on the proportion of immune cells. (C) Correlation stroma of the abundance of six immune cells. (D) Summary of survival analysis of patients in different groups. (E) Uni-Cox and Multi-Cox regression analysis of CCR5, CD3E, CD4, and HLA-DRB1 four genes. (F) Survival analysis of CCR5, CD3E, CD4, and HLA-DRB1 four genes in the high-risk group and the low-risk group. (G) Optimal number of clusters by unsupervised clustering analysis.

