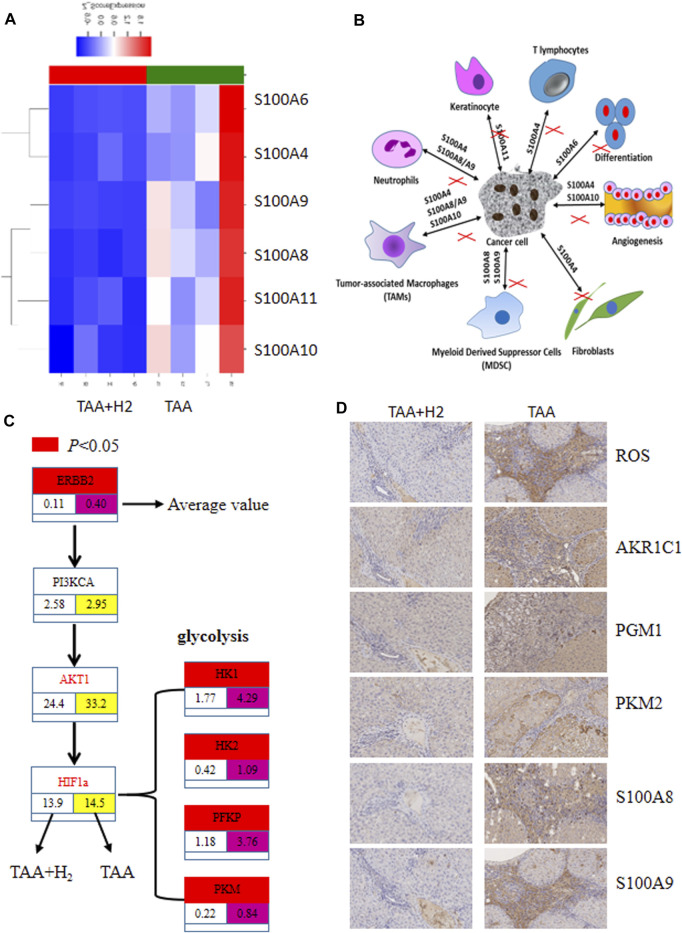
FIGURE 4.
RNA-seq analysis revealed differential gene expression between the livers from the TAA and TAA + H2 groups. (A) Four livers from the TAA group and four livers from the TAA + H2 group were subjected to RNA-seq analysis, and multiple members of the S100 gene family were highly expressed in the TAA group but showed low expression in the TAA + H2 group. (B) Schematic diagram of the interaction between cancer cells and stroma cells which can be blocked by H2. (C) ERBB2 and rate-limiting enzymes in glycolysis were significantly decreased by H2 treatment compared with no H2 treatment. (D) Immunohistochemistry was used to detect the expression of ROS, AKR1C1, PGM1, PKM2, S100A8, and S100A9 on the liver samples from the TAA group and the TAA + H2 group. IHC ×100.

