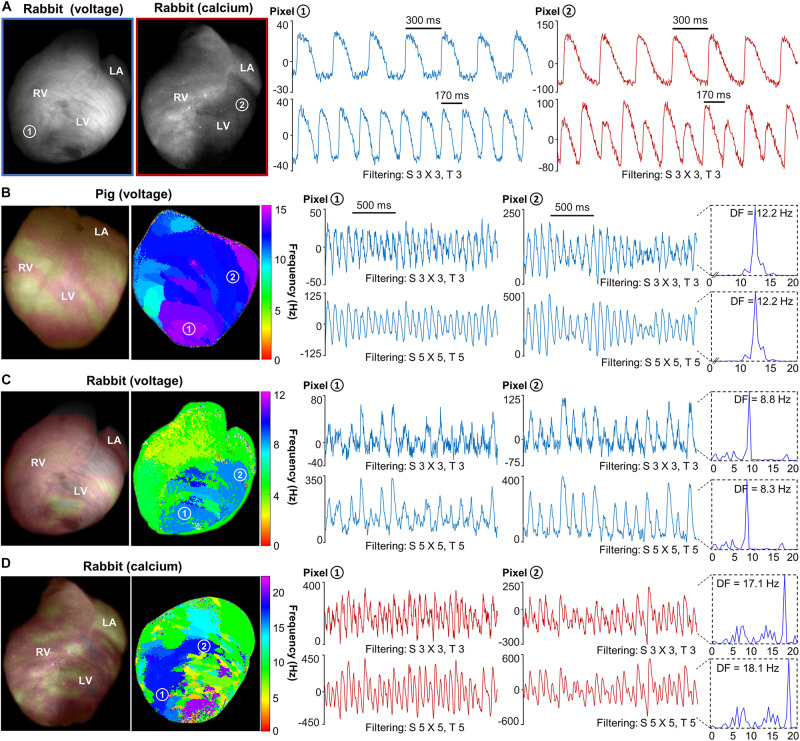
FIGURE 4.
Optical mapping of voltage and calcium alternans and ventricular fibrillation. (A) Baseline fluorescence image of sample rabbit hearts after dye loading with di-4-ANBDQBS (voltage) and rhod-2AM (calcium), respectively (two leftmost panels). Normalized fluorescence signals showing action potential and calcium transient alternans at 300 and 170 ms pacing cycle lengths from representative pixels on the rabbit hearts. (B) Normalized fluorescence snapshot of a pig heart at one time point during ventricular fibrillation (post-optimization, bright/dark areas represent depolarized/repolarized tissue, respectively; arbitrary units) and associated dominant frequency (DF) map of a 5-s-long recording (two leftmost panels). Normalized fluorescence signals of action potentials during ventricular fibrillation and associated DF values from pixels 1 and 2. (C) Normalized fluorescence snapshot of a rabbit heart at one time point during ventricular fibrillation and associated DF map of a 5-s-long recording (two leftmost panels). Normalized fluorescence signals of action potentials during ventricular fibrillation under flecainide effect and associated DF values from pixels 1 to 2. (D) Normalized fluorescence snapshot of a rabbit heart at one time point during ventricular fibrillation and associated DF map of a 5-s-long recording (two leftmost panels). Normalized fluorescence signals of calcium transients during ventricular fibrillation and associated DF values from pixels 1 to 2. Blue and red color signals show optical action potentials and calcium transients, respectively. Two different spatial (S) and temporal (T) filtering are shown as indicated in panels (B–D). LA, left atrium; LV, left ventricle; RV, right ventricle.

