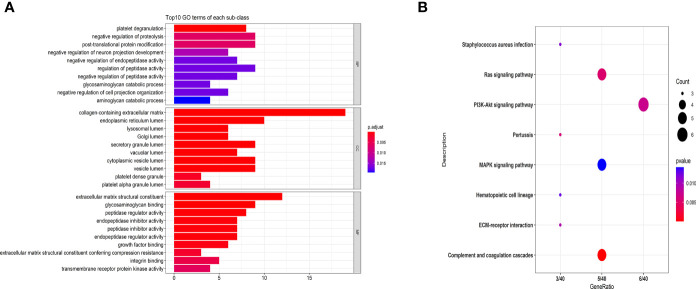
Figure 2.
GO (A) and KEGG pathway analyses (B) of MS-related proteins. Classification of 83 DEPs based on biological processes, molecular functions, cellular components (A) and KEGG pathways (B). (A) The abscissa represents the number of DEPs in each functional classification. (B) The ordinate represents the significantly enriched KEGG pathway, and the abscissa represents the number of genes enriched in the KEGG pathway/total number of genes. The colors in the figure indicate the magnitude of the p-value. The size of the point represents the gene number.

