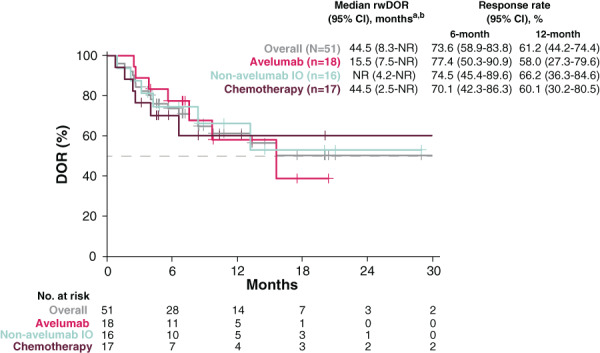
Figure 2.

Kaplan‐Meier plot for rwDOR to 1L treatment. This figure presents the unadjusted Kaplan‐Meier curves of rwDOR from first documented response of CR or R‐NOS to the earliest date of first progression (as defined by physician progress note or imaging report), recurrent disease or death, or initiation of next treatment. aUnadjusted Kaplan‐Meier estimate. brwDOR in chemotherapy patients is influenced by two long‐term responders with 40+ months of rwDOR. Median rwDOR for chemotherapy is 6.5 months without these two patients. Abbreviations: 1L, first line; CI, confidence interval; CR, complete response; DOR, duration of response; IO, immunotherapy; NR, not reached; R‐NOS, response not otherwise specified; rwDOR, real‐world duration of response.
