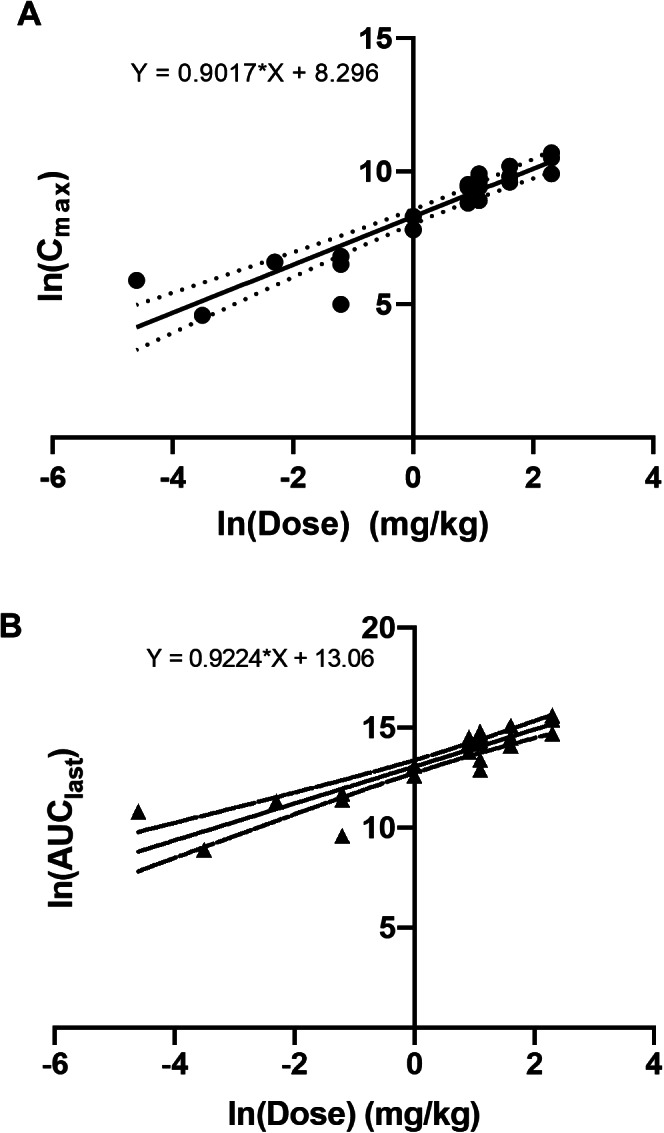
Figure 2.

Relationship between natural log‐transformed dose and Cmax (A) and AUClast (B). Slopes were calculated by nonlinear regression analysis. Abbreviations: AUClast, area under the curve until the last measurement; Cmax, maximum plasma concentration.
