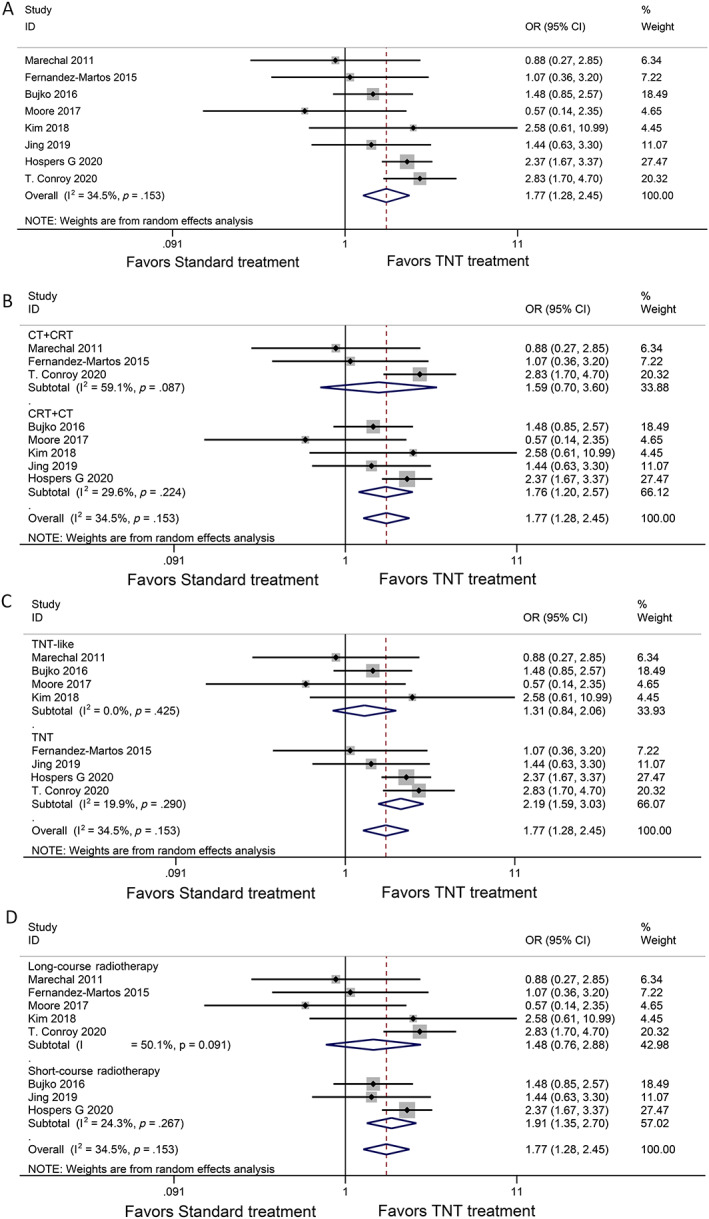
Figure 2.

Forest plots for pathologic complete response. (A): Pathologic complete response with total neoadjuvant therapy versus standard chemoradiation, (B) subgroup analysis induction chemotherapy followed by chemoradiotherapy (CRT) vs. CRT followed by consolidation chemotherapy, (C) subgroup analysis TNT‐like vs. TNT, (D) subgroup analysis. Long‐course radiotherapy vs. short‐course radiotherapy are shown. Abbreviations: CI, confidence interval; OR, odds ratio; TNT,
